Want to simplify and automate your statistical analysis? Try Kure.
GoLeanSixSigma.com Black Belts learn about each statistical test below in our Black Belt Training & Certification course – and how to use them in both Minitab 17 and SigmaXL. For your convenience, we’ve organized the tools by:

Free Example Data Sets Available for Minitab & SigmaXL
Tools Ordered by DMAIC Phase
Black Belt Tools in this list are sorted by DMAIC Phase. At the end of each item, we mention which Module the tool is covered in so you can reference that Module if needed.
Measure Phase
- Normality Test (Anderson-Darling Test for Normality)
- Anderson-Darling Test for Normality (Normality Test)
- Gage R&R – Continuous (MSA – Continuous)
- Gage R&R – Discrete (MSA – Discrete)
- MSA – Continuous (Gage R&R – Continuous)
- MSA – Discrete (Gage R&R – Discrete)
- Sample Size Calculation (Continuous)
- Sample Size Calculation (Discrete)
- Process Capability Test (Continuous)
- Process Capability Test (Discrete)
Improve Phase
- Design of Experiments (DOE) – One Factor at a Time (OFAT)
- Design of Experiments (DOE) – Two Factorial
- Design of Experiments (DOE) – Fractional Factorial
Control Phase
- I & MR Chart
- X-Bar & R Chart
- X-Bar & S Chart
- P Chart
- nP Chart
- C Chart
- U Chart
- Maintaining Historical Parameters
Analyze Phase
- Scatter Plot
- Run Chart
- Box Plot
- Histogram
- Pareto Chart
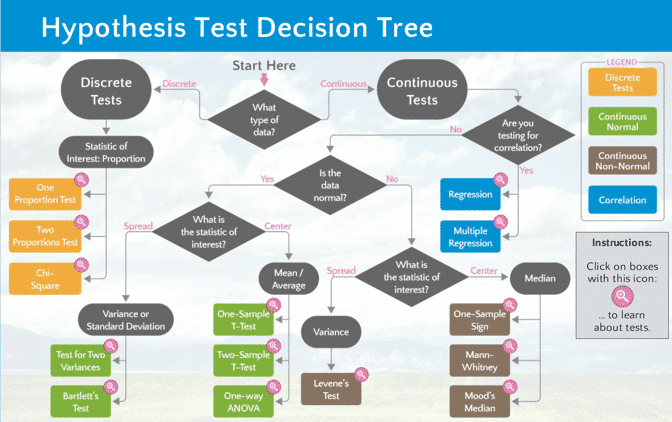
- One Proportion Test
- Two Proportions Test
- Chi-Square Test
- F-Test (Test for Two Variances)
- Test for Two Variances (F-Test)
- Bartlett’s Test
- One-Sample T-Test
- Two-Sample T-Test
- One-Way ANOVA Test
- Levene’s Test
- One-Sample Sign Test
- Mann-Whitney Test
- Mood’s Median Test
- Regression Test
- Multiple Regression Test
Tools Ordered Alphabetically
Black Belt Tools in this list are sorted alphabetically. At the end of each item, we mention which Module the tool is covered in so you can reference that Module if needed.
- Anderson-Darling Test for Normality (Normality Test)
- Bartlett’s Test
- Box Plot
- C Chart
- Chi-Square Test
- Design Of Experiments (DOE) – One Factor At A Time (OFAT)
- Design Of Experiments (DOE) – Fractional Factorial
- Design Of Experiments (DOE) – Two Factorial
- DPMO
- F-Test (Test for Two Variances)
- Gage R&R – Continuous (MSA – Continuous)
- Gage R&R – Discrete (MSA – Discrete)
- Histogram
- I & MR Chart
- Levene’s Test
- Maintaining Historical Parameters
- Mann-Whitney Test
- Mood’s Median Test
- MSA – Continuous (Gage R&R – Continuous)
- MSA – Discrete (Gage R&R – Discrete)
- Multiple Regression Test
- Normality Test (Anderson-Darling Test for Normality)
- nP Chart
- One Proportion Test
- One-Sample T-Test
- One-Sample Sign Test
- One-Way ANOVA Test
- P Chart
- Pareto Chart
- Process Capability Test (Continuous)
- Process Capability Test (Discrete)
- Regression Test
- Run Chart
- Sample Size Calculation (Continuous)
- Sample Size Calculation (Discrete)
- Scatter Plot
- Test for Two Variances (F-Test)
- Two Proportions Test
- Two-Sample T-Test
- U Chart
- X-Bar & R Chart
- X-Bar & S Chart
Learn more about Minitab and SigmaXL by visiting their websites at Minitab.com and SigmaXL.com.
For a better understanding of each of these tools, please register for our Black Belt Training & Certification.


