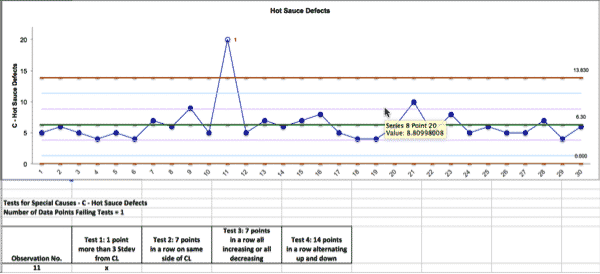
What’s A C Chart?
C Charts are Control Charts designed for tracking the count of defects for discrete data in consistently sized sub-groups.
A classic example of a C Chart is to track the number of defects per application, which are all 10 pages each.
Learn more about C Charts in Control Phase, Module 6.1.6 of Black Belt Training.
How To Run A C Chart In SigmaXL
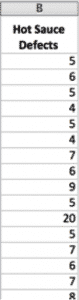
Download the GoLeanSixSigma.com C Chart Data Set for SigmaXL here.
1. Select Raw Data:
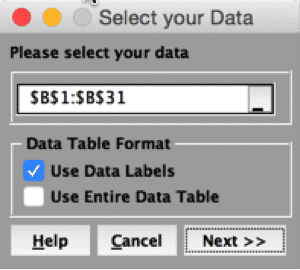
2. Highlight the data:
3. Go to Stat > Control Charts > Attribute Charts> C
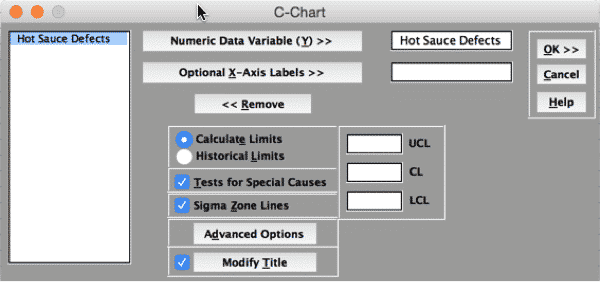
4. Click “OK”