What’s An I & MR Chart (aka X & MR or Chart)?
I & MR Charts are Control Charts designed for tracking single points of continuous data. They consist of two separate charts; “I” stands for the “Individual” Chart which tracks the individual data points (or pre-summarized data) and “MR” stands for “Moving Range” Chart which tracks the absolute value of the distance between each pair of consecutive data points. These are considered the most flexible of the Control Charts and are often used to track business performance data.
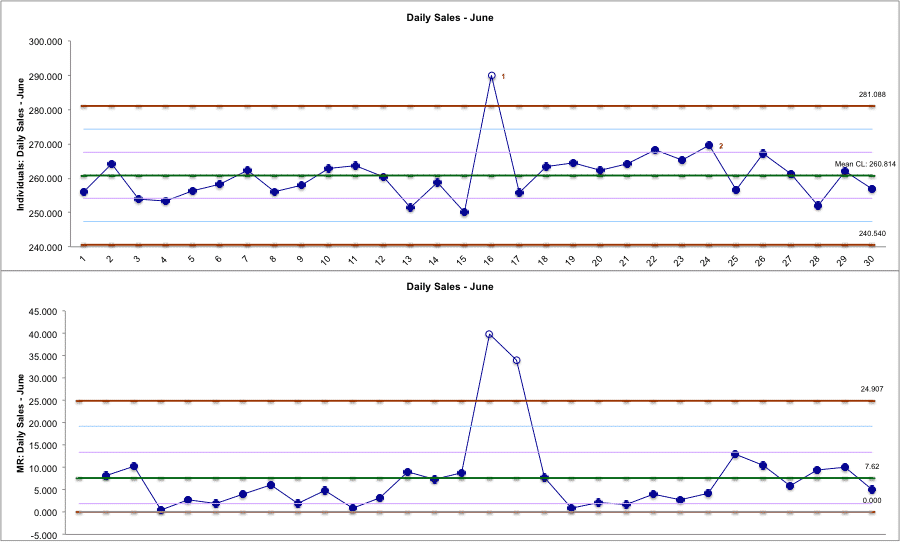
A classic example of an I & MR Chart is to track daily total sales.
Learn more about I & MR Charts in Control Phase, Module 6.1.1 of Black Belt Training.
How To Run An I & MR Chart In SigmaXL
Download GoLeanSixSigma.com I & MR Chart Data Sets for SigmaXL here.
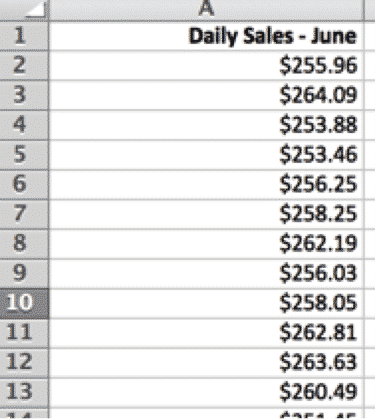
1. Highlight the data:
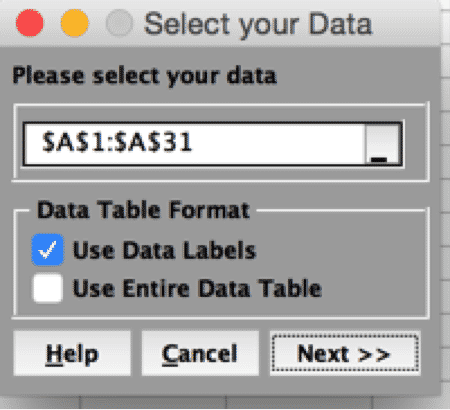
2. Select Control Charts > Individual and Moving Range:
3. Click “Next>>”:
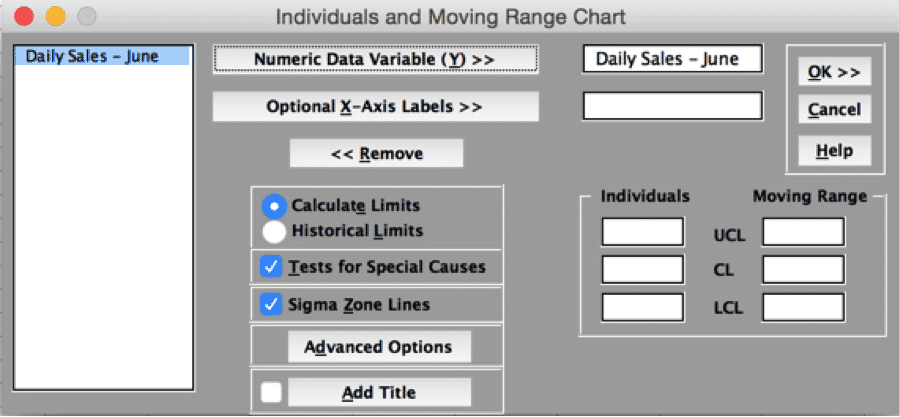
4. Click “OK >>”