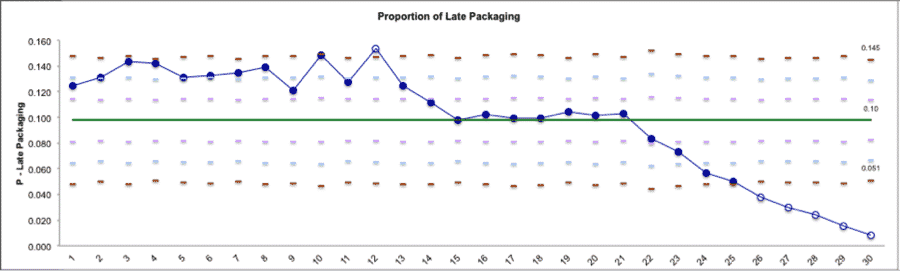
What’s A P Chart?
P Charts are Control Charts designed for tracking the proportion defective for discrete data.These charts require both the total population as well as the count of defective units in order to plot the proportion.
A classic example a P Chart is to track the proportion of defective products returned each month.
Learn more about P Charts in Control Phase, Module 6.1.4 of Black Belt Training.
How To Run A P Chart In SigmaXL
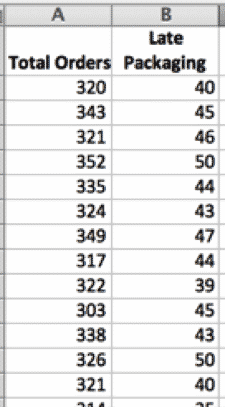
Download the GoLeanSixSigma.com P Chart Data Set for SigmaXL here.
1. Highlight both columns of data:
2. Go to Stat > Control Charts > Attribute Charts > P:
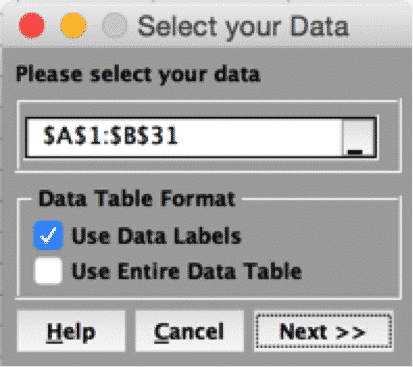
3. Click “Next>>”:
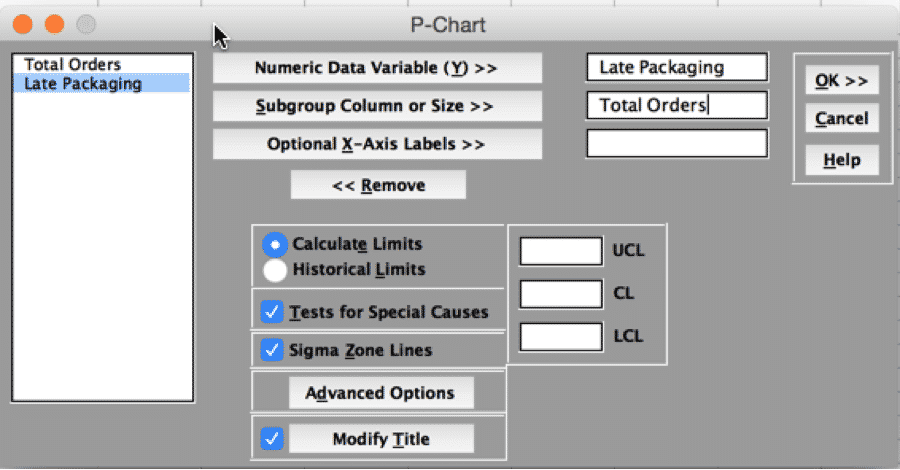
4. Click “OK>>”:
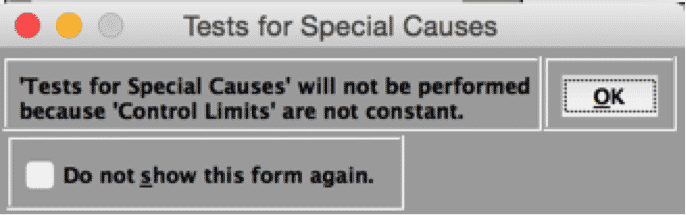
5. Click “OK”: