What’s Design of Experiments (DOE) – One Factor at a Time (OFAT)?
DOE, or Design of Experiments is an active method of manipulating a process as opposed to passively observing a process. DOE enables operators to evaluate the changes occurring in the output (Y Response,) of a process while changing one or more inputs (X Factors).
Learn more about Design Of Experiments (DOE) – One Factor At A Time (OFAT) in Improve Phase, Module 5.1.1. of Black Belt Training.
How to Run a Design of Experiments (DOE) – One Factor at a Time (OFAT) in Minitab
1. Create the Factorial Design by going to Stat > DOE > Factorial > Create Factorial Design:

2. Next, ensure that [2-level factorial (default generator)] is selected
3. Input/Select [2] for the [Number of Factors]
4. Click on [Designs…]:

5. Ensure that [Full Factorial…] is highlighted
6. Input/Select [3] for [Number of replicates for corner points]
7. Click OK:

8. Select [Options] and uncheck [Randomize runs], make sure [Store design in worksheet is checked]
9. Click OK:

10. Select [Factors] and the dialog box below will show-up; load in the factor names and level settings
11. Click OK:

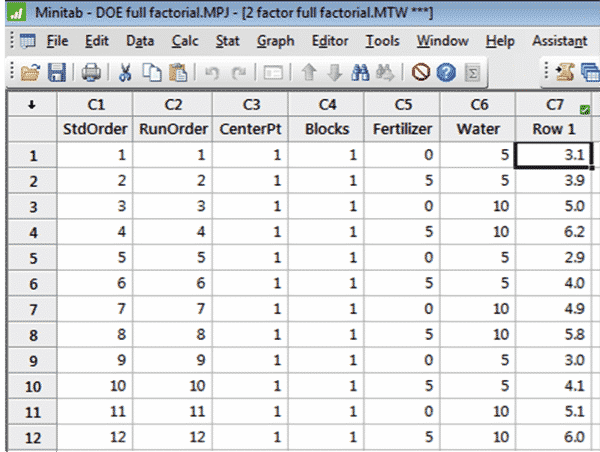
Minitab will create a worksheet containing the DOE array:

The first blank column in the worksheet (here C7) is reserved for the Response values
After running all of the experimental runs enter the results in to the worksheet
The second series of steps allow us to analyze the results as well as produce the charts and graphs that help us communicate our results.
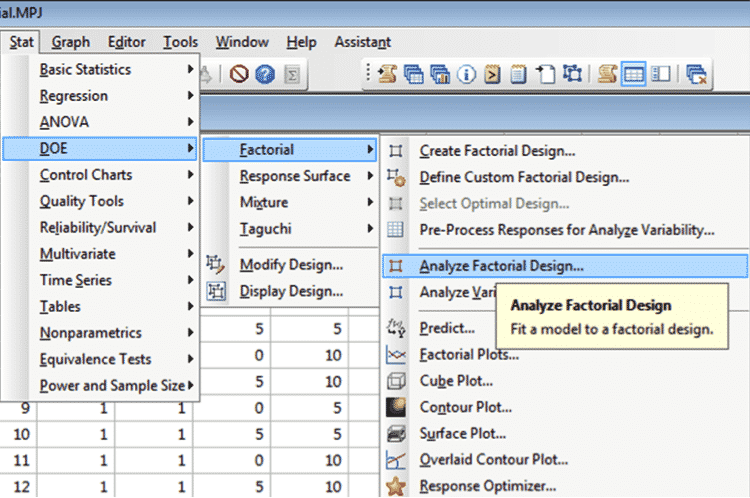
12. Go to Stat > DOE > Factorial > Analyze Factorial Design:
13. Enter the column (here C7) that contains the response in the open window called Responses (or just double-click on C7 in the left box)
14. Then click on [Terms…]:

15. Select the terms you want in the model (in our case we want both factors; Fertilizer and Water)
16. Either double click on the term or use the [>] between the windows
17. Then click [OK]:

18. This time select [Graphs…]:

19. Select/Check [Pareto]
20. Click [OK]:

The following Pareto chart of the results is very effective in communicating the experimental outcomes:

The details behind the analysis will be contained in the Minitab Worksheet.
This is the ANOVA table for the experiment:

