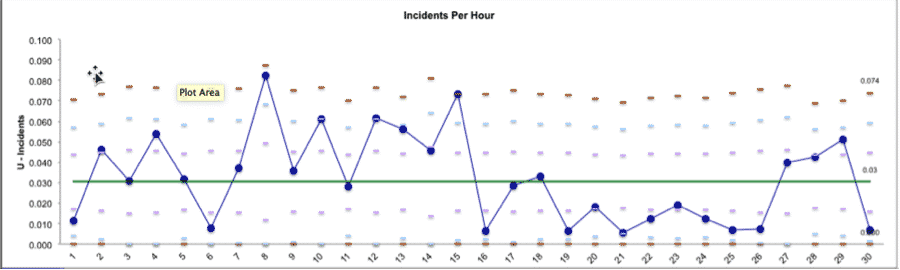
What’s A U Chart?
U Charts are Control Charts designed for tracking the number of defects per unit for discrete data.
A classic example of a C Chart is to track the number of scratches on new smart phone cases at a manufacturing facility.
Learn more about U Charts in Control Phase, Module 6.1.7 of Black Belt Training.
How To Run A U Chart In SigmaXL
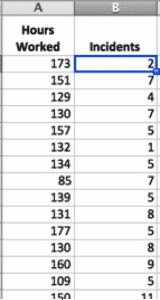
Download the GoLeanSixSigma.com U Chart Data Set for SigmaXL here.
1. Highlight the Raw Data:
2. Go to Stat > Control Charts > Attribute Charts > U:
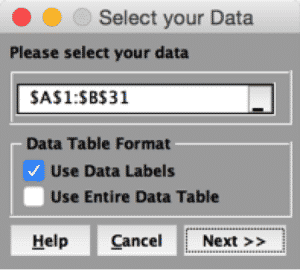
3. Click “Next>>”:
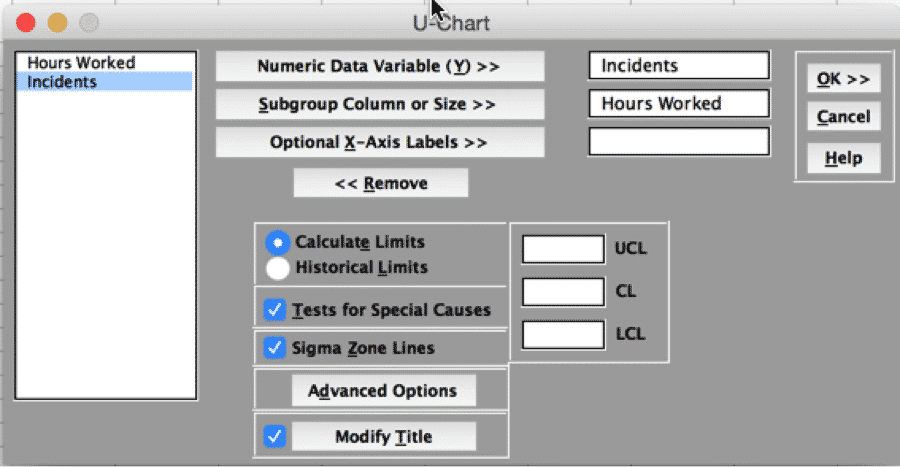
4. Click “OK>>”:
5. Click “OK”: