What’s a Histogram?
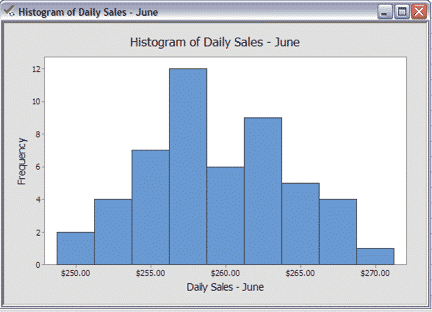
Histograms are frequency charts. In Lean Six Sigma, they show the distribution of values produced by a process. In other words, a histogram is a visual display of how much variation exists in a process.
Learn more about Histograms in Green Belt Training.
How to Create a Histogram in Minitab
Download the GoLeanSixSigma.com Histogram Data Set for Minitab here.
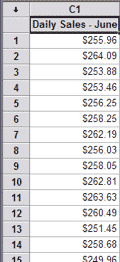
1. Open Histogram Data Set
2. Go to Graph > Histogram > Simple:
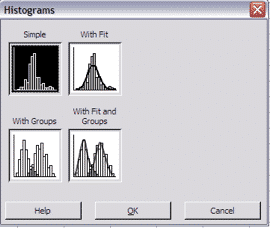
3. Click “OK”:
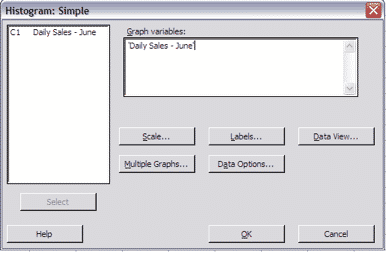
4. Click “OK”:
