What’s a Normality Test (aka Anderson-Darling Test for Normality)?
The Normality Test is a statistical test that determines whether or not a data set is normally distributed. A normal distribution is often referred to as a “Bell Curve.” Whether a distribution is normal or not determines which tests or functions can be used with a particular data set.
Learn more about Normality Tests in Measure Phase, Module 3.1.3 of Black Belt Training.
How to Run a Normality Test in Minitab
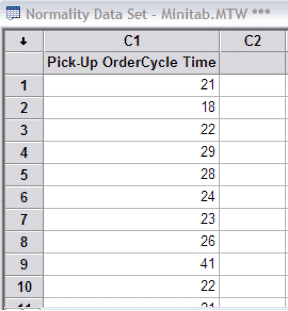
1. Select Raw Data:
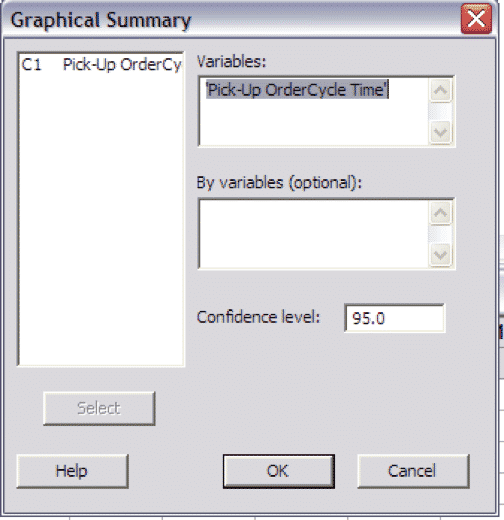
2. Go to Stat > Basic Statistics > Display Graphical Summary
3. Select “Pick-Up Order Cycle Time” as the variable:
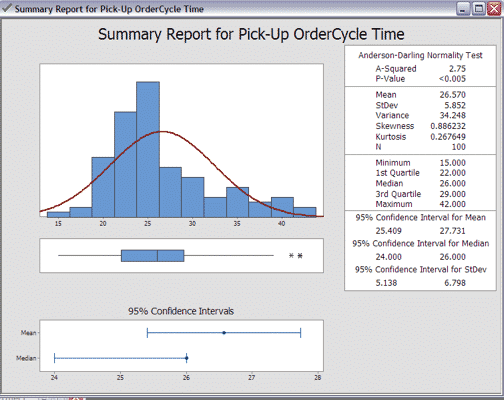
4. Click “OK”: