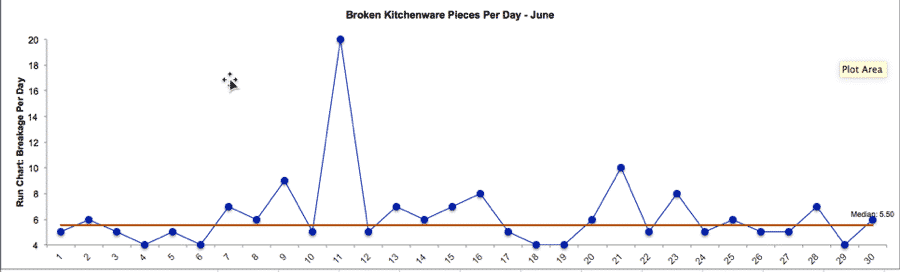
What is a Run Chart?
A Run chart is a graph that displays data in sequence over time. This kind of chart can display continuous or discrete data and generally appears with a median or average line.
Learn more about Run Charts in Green Belt Training.
How to Create a Run Chart in SigmaXL
Download the GoLeanSixSigma.com Pareto Chart Data Set for SigmaXL here.
1. Select the “Run Chart” tab
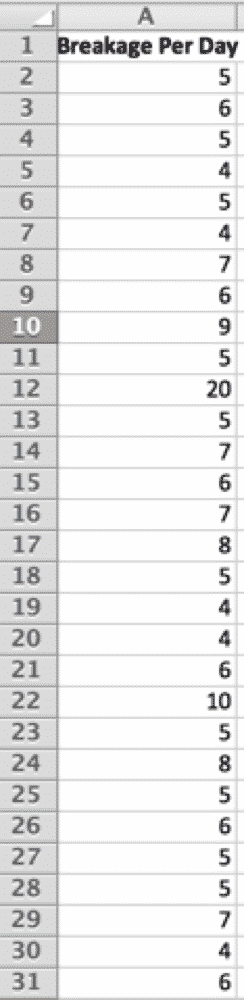
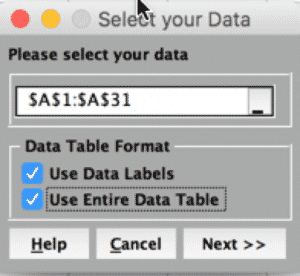
2. Select the raw data:
3. SigmaXL > Graphical Tools > Run Chart:
4. Click “Next”:
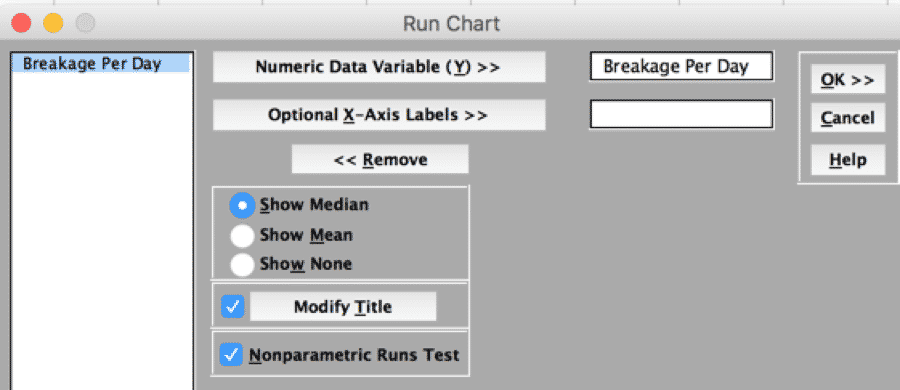
5. Click “OK”: