Home » Blog » How to Run a Design of Experiments – Full Factorial in Minitab
What’s Design of Experiments – Full Factorial in Minitab?
DOE, or Design of Experiments is an active method of manipulating a process as opposed to passively observing a process. DOE enables operators to evaluate the changes occurring in the output (Y Response,) of a process while changing one or more inputs (X Factors).
Learn more about Design of Experiments – Full Factorial in Minitab in Improve Phase, Module 5.1.2. of Black Belt Training.
How to Run a Design of Experiments – Full Factorial in Minitab
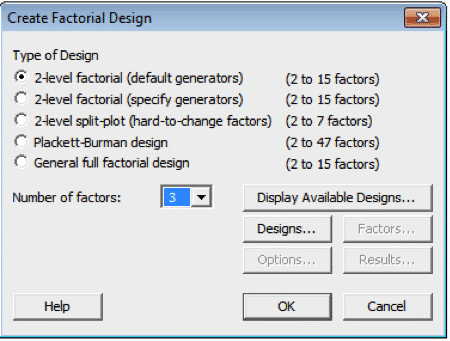
1. Create the Factorial Design by going to Stat > DOE > Factorial > Create Factorial Design:
2. Next, ensure that [2-level factorial (default generator)] is selected
3. Input/Select 3] for the [Number of Factors]
4. Click on [Designs…]:
5. Ensure that [1/2 fraction] is highlighted
6. Input/Select [3] for [Number of replicates for corner points]
7. Click OK:
8. Select [Options] and un-check [Randomize runs], make sure [Store design in worksheet is checked]
9. Click OK:
10. Select [Factors] and the dialog box below will show-up; load in the factor names and level settings
11. Click OK:
Minitab will create a worksheet containing the DOE array:
The first blank column in the worksheet (here C8) is reserved for the Response values
After running all of the experimental runs enter the results in to the worksheet:
The second series of steps allow us to analyze the results as well as produce the charts and graphs that help us communicate our results.
12. Go to Stat > DOE > Factorial > Analyze Factorial Design:
13. Enter the column (here C7) that contains the response in the open window called Responses (or just double-click on C7 in the left box)
14. Then click on [Terms…]:
15. Select the terms you want in the model (in our case we want all three factors)
16. Either double click on the term or use the [>] between the windows
17. Then click OK:
18. This time select [Graphs…]
19. Select/Check [Pareto]
20. Click OK:
The following Pareto chart of the results is very effective in communicating the experimental outcomes:
The details behind the analysis will be contained in the Minitab Worksheet.
This is the ANOVA table for the experiment:
Learn more about Design Of Experiments – Full Factorial In Minitab in Improve Phase, Module 5.1.2 of Black Belt Training.
GLSS (GoLeanSixSigma.com) is an internationally-recognized SaaS platform, offering Lean Six Sigma Training, Certification & Coaching. Together with our sister company, Kure, we leverage patent-pending technology to help businesses of all sizes optimize processes, manage projects, enhance efficiency and develop leadership and management skills — in transforming their companies and communities. No matter the industry, we can help you streamline operations, achieve your strategic goals with proven efficiency improvements and develop your strong team of leaders.