What’s A nP Chart?
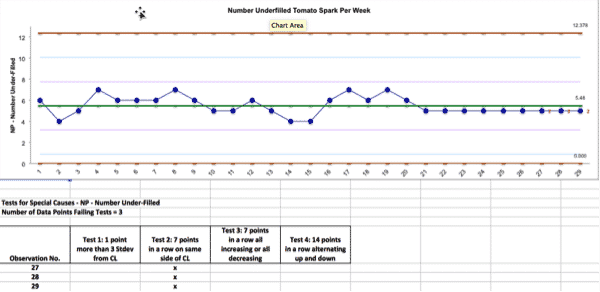
nP Charts are Control Charts designed for tracking the number of defective items for discrete data in consistently sized sub-groups.
A classic example an nP Chart is to track the number of defective products per lot shipped where the lot size was constant.
Learn more about nP Charts in Control Phase, Module 6.1.5 of Black Belt Training.
How To Run A nP Chart In SigmaXL
Download the GoLeanSixSigma.com nP Chart Data Set for SigmaXL here.
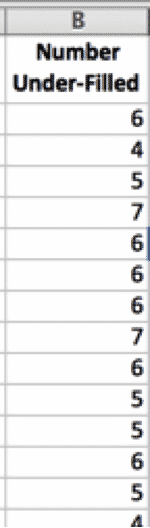
1. Highlight Raw Data:
2. Go to Stat > Control Charts > Attribute Charts > nP:
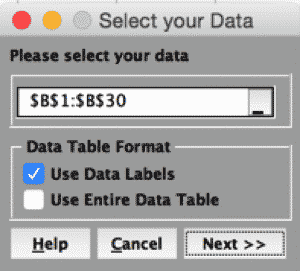
3. Click “Next>>”
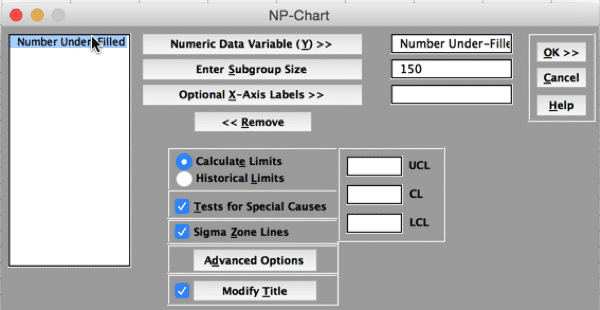
4. Click “OK”:
To learn more about nP Charts, register for Black Belt Training and review Control Phase, Module 6.1.5.
- Download All GoLeanSixSigma.com Data Sets for SigmaXL
- How To Run A nP Chart in Minitab
- More SigmaXL Instructions
