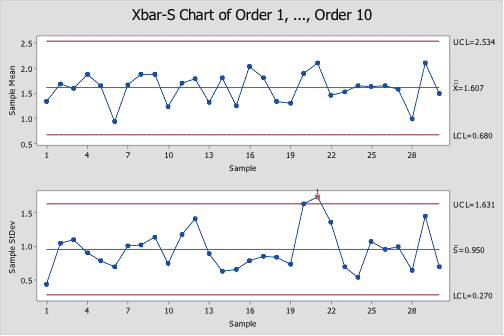
What’s A X-Bar & S Chart?
X-Bar & S Charts are Control Charts designed for tracking the average of large subgroups of continuous data. They consist of two separate charts; “X-Bar” stands for the “Average” Chart which tracks the mean of sub-groups of 6 or more data points and “S” stands for the “Standard Deviation” Chart which calculates the standard deviation within each subgroup. These charts are useful for detecting shifts in the “center” or average with large subgroups.
A classic example an X-Bar & S Chart is to track the food order cycle time to deliver packages by sampling 10 orders per day.
Learn more about X-Bar & R Charts in Control Phase, Module 6.1.3 of Black Belt Training.
How To Run A X-Bar & S Chart In Minitab
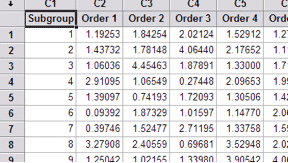
1. Select Raw Data:
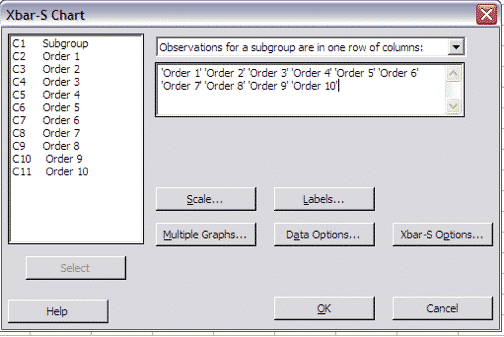
2. Go to Stat > Control Charts > Variables for Subgroups > Xbar & S
3. Select “Observations for a subgroup are in one row of columns”:
4. Click on “Xbar-S Options:
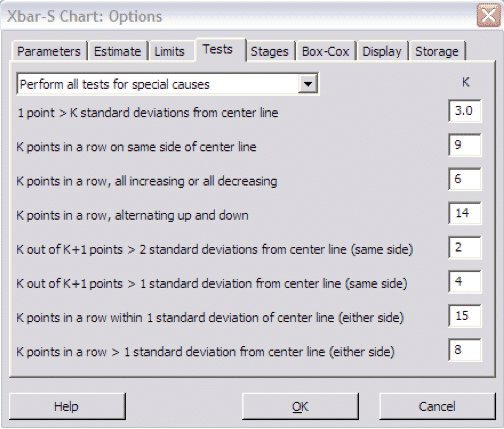
5. Select “Tests” tab and “Perform all tests for special causes”
6. Click “OK”
7. Click “OK” again: