GLSS’s Green Belt Training is the most practical, cost-effective way for you, your team or your entire organization to learn and begin applying the concepts and tools of Lean Six Sigma.
It’s an online, self-paced course that enables learners to complete Lean Six Sigma process improvement projects from start to finish. Green Belts can deliver measurable, sustainable improvement by finding the root causes of problems and streamlining processes.
The following concepts and tools are covered in our Green Belt Training.
MODULE 1: INTRODUCTION
In this Module, you’ll have an overview this course and take a deeper dive into solving problems using facts and data. You’ll walk through each step and incorporate the most efficient and effective way to complete your project.
- Lean Six Sigma Roles
- Variation
- Costs
- Project Screener
- Lean Six Sigma Roles
- Variation
- Costs
- Project Screener
- Project Charter
- Goal Statement
- Problem Statement
- Scope
- Business Case
- Project Timeline
- Team Members
- Voice of the Customer
- SIPOC
- Project Charter
- Goal Statement
- Problem Statement
- Scope
- Business Case
- Project Timeline
- Team Members
- Voice of the Customer
- SIPOC
MODULE 3: MEASURE PHASE
The focus of the Measure Phase is to more fully understand our process and quantify its performance. By the end of this Module, you’ll be able to develop an As-Is Map, design a Data Collection Plan, and collect Baseline Data.
- Data Collection
- Operational Definitions
- Baseline Data
- Run Chart
- Check Sheets
MODULE 4: ANALYZE PHASE
In the Analyze Phase, you’ll apply your understanding of your process to identify what is causing the problem you’re trying to solve. You’ll dig into that information to find clues to problem causes.
- Process Analysis
- Value Analysis
- Data Analysis
- Clues
- Histogram
- Box Plot
- Pareto Chart
- Pie Chart
- Fishbone Diagram
- 5 Whys Revisited
- Root Cause Hypothesis
- Root Cause Confirmation
- Process Analysis
- Value Analysis
- Data Analysis
- Clues
- Histogram
- Box Plot
- Pareto Chart
- Pie Chart
- Fishbone Diagram
- 5 Whys Revisited
- Root Cause Hypothesis
- Root Cause Confirmation
MODULE 5: IMPROVE PHASE
After confirming the root cause(s), you’ll need to determine what to do about them. In the Improve Phase, you’ll develop feasible solutions, implement them, revise your Process Map, and verify that your actions are working.
- Developing Solutions
- Filtering Solutions
- Solution Selection
- Mistake-Proofing
- Implementation Plan
- To-Be Map
- Verification
- Developing Solutions
- Filtering Solutions
- Solution Selection
- Mistake-Proofing
- Implementation Plan
- To-Be Map
- Verification
MODULE 6: CONTROL PHASE
In the Control Phase, you’ll ensure that you have sufficient control of the changed process so the wins you’ve earned are maintained. You’ll also prepare to wrap the project by identifying other opportunities discovered and make an orderly handoff to the Process Owner.
- Monitoring & Response Plan
- Innovation Transfer Opportunities
- Project Handoff
- Project Summary
- Monitoring & Response Plan
- Innovation Transfer Opportunities
- Project Handoff
- Project Summary
- Green Belt Table of Contents (v4.0 / 2019)
Introduction Phase
Green Belt Online Training Introduction 1.1 Step: Overview of Lean Six Sigma 2.1 What Is Lean Six Sigma? 2.3 Where Did Lean Six Sigma Come From? 2.6 Why Do Organizations Use Lean Six Sigma? 2.7 Cost of Poor Quality 2.9 Connect With the Customer 2.12 Reduce Variation 2.13 Focus on the Process 2.14 Quantify the Dollar Impact 2.15 Engage the People 2.16 Step: 8 Wastes (DOWNTIME) – Template Available 3.1 Defects 3.8 Overproduction 3.8 Waiting 3.8 Non-Utilized Talent 3.8 Transportation 3.8 Inventory 3.8 Motion 3.8 Extra-Processing 3.8 Step: Lean Six Sigma Roles 4.1 White Belt 4.4 Yellow Belt 4.5 Green Belt 4.6 Black Belt 4.7 Master Black Belt 4.8 Champion/Sponsor 4.9 Process Owner 4.10 Team Roles and Project Roles – Template Available 4.11 Step: PDCA Overview 5.1 PDCA and Toyota’s 8-Step Problem-Solving Process 5.5 Step: DMAIC Overview 6.1 Project Types 6.3 DMAIC Methodology 6.5 DMAIC and PDCA 6.6 Step: Project Selection 7.1 Project Selection Guidelines – Template Available 7.3 Starting a Green Belt Project During Training 7.7 Introduction Phase Conclusion 8.1 Challenges 8.5 Green Belt Project Journey 8.6 Introduction Steps and Tools Recap 8.7 Tollgate Checklist – Template Available 8.8 Deliverables 8.9 Measure Phase
Measure and Baseline the Problem
Measure Phase Introduction 1.1 Step: Select Measures 2.1 Value Stream Definitions 2.8 Measuring Customer Demand (Takt Time) 2.10 Data Types 2.20 Continuous and Discrete Measures 2.21 Efficiency & Effectiveness – Template Available 2.27 Step: Plan for Data Collection 3.1 Data Collection Plan – Template Available 3.3 Module: Operational Definitions – Template Available 3.10 Module: Stratification 3.20 Module: Check Sheets – Template Available 3.24 Standard Event Occurrence Check Sheets 3.27 Classification Check Sheet 3.29 Frequency Plot Check Sheet 3.30 Traveller Check Sheet 3.31 Confirmation Check Sheet or Checklist 3.32 Concentration Diagram Check Sheet 3.33 Module: Sampling 3.38 Module: Measurement Systems Analysis (MSA) 3.55 Step: Collect Baseline Data 4.1 Defects Per Unit (DPU) 4.7 Defects Per Million Opportunities (DPMO) 4.9 Sigma 4.11 Percent Defective 4.17 Final Yield 4.19 Rolled Throughput Yield 4.20 Cost of Poor Quality (COPQ) – Template Available 4.24 Measure Phase Conclusion 5.1 Challenges 5.9 Green Belt Project Journey 5.10 Steps and Tools Recap 5.11 Tollgate Checklist – Template Available 5.12 Deliverables 5.13 Analyze Phase
Identify the Root Causes of Problems and Waste Within the Process
Analyze Phase Introduction 1.1 Step: Conduct Process Analysis 2.1 Rework Loops 2.4 Redundancies 2.6 Bottlenecks 2.8 Inspections & Decisions 2.10 Handoffs 2.12 Module: Value Analysis 2.17 Value-Added Flow Analysis – Template Available 2.22 Module: Value Stream Map (VSM) Analysis – Template Available 2.27 Step: Conduct Data Analysis 3.1 Module: Histogram 3.4 Module: Pie and Bar Charts 3.18 Module: Pareto Chart 3.21 Module: Run Chart 3.27 Module: Box Plot 3.31 Step: Brainstorm Root Causes 4.1 Module: Affinity Analysis 4.3 Module: The 5 Whys & The Fishbone Diagram 4.7 Fishbone Diagram – Template Available 4.9 5 Whys – Template Available 4.13 Step: Develop Root Cause Hypotheses 5.1 Step: Validate Root Cause Hypotheses 6.1 Verification by Observation 6.4 Verification by Listening 6.5 Confirming Hypotheses With Data 6.8 Hypothesis Testing Tools 6.10 Scatter Plot 6.11 Step: Analyze Phase Conclusion 7.1 Challenges 7.6 Green Belt Project Journey 7.7 Steps and Tools Recap 7.8 Tollgate Checklist – Template Available 7.9 Deliverables 7.10 Improve Phase
Implement and Verify Solutions to Address Root Cause
Improve Phase Introduction 1.1 Step: Craft Solutions 2.1 Module: Team Member Review 2.3 Module: Brainstorm Solutions 2.6 Analogy 2.12 Anti-Solution 2.13 Brain-Writing 2.14 Channeling 2.15 Module: Lean Improvement Principles 2.18 Module: Single-Piece Flow & Batch Reduction 2.26 Module: Changeover Reduction 2.33 Module: Work Cell Design 2.44 Module: Workload Balancing & Demand Leveling 2.55 Module: Cross-Training & Parallel Processing – Template Available 2.60 Module: Kanban & Supermarkets 2.68 Module: Standard Work – Template Available 2.84 Module: 5S – Template Available 2.96 1: Sort 2.102 2: Set In Order 2.106 3: Shine 2.110 4: Standardize 2.114 5: Sustain 2.115 Module: Future State Map 2.120 Step: Filter Solutions 3.1 Module: Impact Effort Matrix – Template Available 3.4 Module: Weighted Criteria Matrix – Template Available 3.10 Module: Solution Selection Matrix – Template Available 3.17 Step: Conduct Risk Management 4.1 Module: Failure Modes and Effects Analysis (FMEA) – Template Available 4.4 Module: Mistake-Proofing (Poka-yoke) 4.22 Module: Visual Management – Template Available 4.30 Andon 4.37 Kanban Boards 4.38 Task Boards 4.39 Step: Determine Solution Approach 5.1 Module: Rapid Improvement Event (Kaizen) 5.5 Module: Pilot the Solution – Template Available 5.10 Module: Multi-Phase Implementation 5.16 Module: Full Scale Rollout 5.21 Improve Phase Conclusion 6.1 Challenges 6.10 Green Belt Project Journey 6.11 Steps and Tools Recap 6.12 Tollgate Checklist – Template Available 6.13 Improve Phase 6.14 Control Phase
Maintain the Gains
Control Phase Introduction 1.1 Step: Create Monitoring Plans – Template Available 2.1 Module: Control Charts – Template Available 2.11 Step: Develop Response Plans – Template Available 3.1 Step: Document the Project 4.1 Project Storyboard – Template Available 4.4 Executive Summary – Template Available 4.6 New Procedure Audit – Template Available 4.12 Project Closure – Template Available 4.14 Step: Pursue Perfection 5.1 Innovation Transfer – Template Available 5.3 Waste Walk 5.10 Control Phase Conclusion 6.1 Challenges 6.5 Green Belt Project Journey 6.6 Steps and Tools Recap 6.7 Tollgate Checklist – Template Available 6.8 Deliverables 6.9 Overview of Black Belt Training & Certification 7.3 Back to the overview of Lean Six Sigma Green Belt Training & Certification.
Interested in Free Lean Six Sigma Training? Click here for information on our Yellow Belt Training & Certification. For more advanced Black Belt Training & Certification, click here.
COURSE OUTLINES & COMPARISON
Yellow Belt
Green Belt
Black Belt
| Pricing | Yellow Belt | Green Belt | Black Belt |
|---|---|---|---|
| Training Cost | $99.00 | $599.00 | $999.00 |
| Certification Cost | Included | Included | Included |
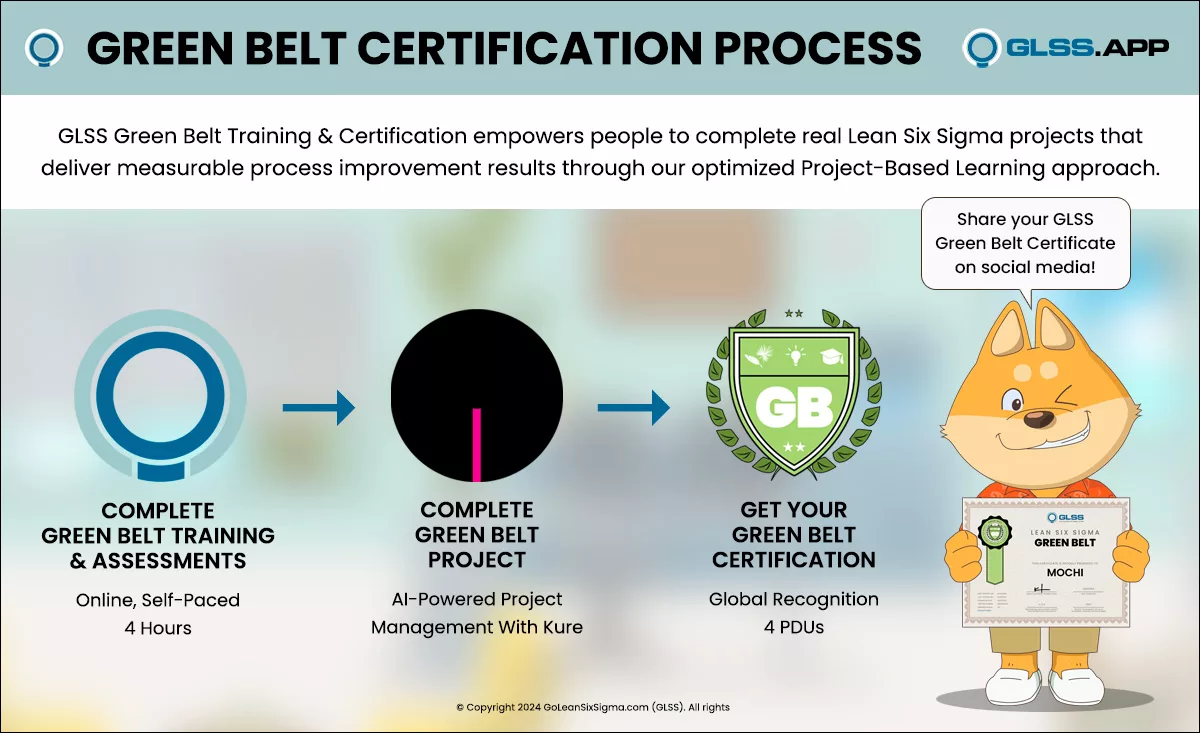
| Estimated Completion Time | 2 Hours | 4 Hours | 8 Hours |
| Learning Management System | |||
| Training | Online, Self-Paced | Online, Self-Paced | Online, Self-Paced |
| Certification | 40 Multiple Choice Questions | 80 Multiple Choice Questions | 120 Multiple Choice Questions |
| Recertification Required? | |||
| Project Management Software | Optional (Kure) | Optional (Kure) | Optional (Kure) |
| Statistical Software | Optional (Kure) | Optional (Kure) | Optional (Kure) |
| Coaching | Optional | Optional | Optional |
| PDUs | 2 PDUs | 4 PDUs | 8 PDUs |
| Pricing | Yellow Belt | Green Belt | Black Belt |
|---|---|---|---|
| What is Lean Six Sigma? | - | - | |
| Benefits of Lean Six Sigma | - | - | |
| Who Uses Lean Six Sigma? | - | - | |
| Lean Six Sigma Roles | - | ||
| DMAIC Overview | - | ||
| Project Selection | - | ||
| Ethical Efficiency | - | - | |
| Build Leadership Skills | - | - |
| Pricing | Yellow Belt | Green Belt | Black Belt |
|---|---|---|---|
| Project Charter | - | ||
| Problem/Opportunity Statement | - | - | |
| Goal Statement | - | - | |
| Business Case | - | - | |
| Project Timeline | - | - | |
| Customer Value | - | - | |
| Voice of the Customer (VOC) Translation Matrix | - | - | |
| SIPOC (High Level Process Map) | - | - | |
| Define Phase: Common Challenges | - | - | |
| Multi-Generation Plan | - | - | |
| Value Finder | - | - | |
| Risk Assessment | - | - | |
| Leadership | - | - | |
| Ethical Efficiency | - | - |
| Pricing | Yellow Belt | Green Belt | Black Belt |
|---|---|---|---|
| Selecting Measures | |||
| Process Walk | - | ||
| Organizational Level Process Map | - | ||
| The 8 Wastes | - | ||
| Swimlane Map | - | ||
| Spaghetti Map | - | - | |
| Data Types | - | ||
| Basic Statistical Terms | - | ||
| Measure Phase: Common Challenges | - | - | |
| Data Collection Planning | - | ||
| Operational Definitions | - | - | |
| Stratification | - | - | |
| Run Chart | - | - | |
| Check Sheets | - | - | |
| Sampling | - | - | |
| Sampling Strategy | - | - | |
| Sampling Calculations | - | - | |
| Measurement Systems Analysis | - | ||
| Sources of Measurement Errors | - | - | |
| Evaluating Data Reliability | - | - | |
| Capturing Baseline Data | |||
| Baseline Measures | - | ||
| Leadership | - | - | |
| Cost of Poor Quality (COPQ) | - | - | |
| Ethical Efficiency | - | - |
| Pricing | Yellow Belt | Green Belt | Black Belt |
|---|---|---|---|
| Process Analysis | - | ||
| Rework Loops | - | - | |
| Analyze Phase: Common Challenges | - | - | |
| Hypothesis Testing | - | - | |
| Decisions From Data | - | - | |
| Handoffs | - | ||
| Null & Alternate Hypothesis | - | - | |
| P-Value | - | - | |
| Conduct Data Analysis | - | ||
| Histograms | - | - | |
| Pie & Bar Charts | - | - | |
| Run Charts | - | - | |
| Box Plots | - | - | |
| 5 Whys | - | ||
| Fishbone Diagram | - | - | |
| Develop a Hypothesis | - | ||
| One Sample Test | - | - | |
| Two Sample Test | - | - | |
| Normality Test | - | - | |
| Randomness Test | - | - | |
| Correspondence Test | - | - | |
| Correlation | - | - | |
| Correlation Coefficient (R) | - | - | |
| R-Squared | - | - | |
| Regression | - | - | |
| Regression Equation | - | - | |
| Leadership | - | - | |
| Ethical Efficiency | - | - |
| Pricing | Yellow Belt | Green Belt | Black Belt |
|---|---|---|---|
| Team Member Review | - | - | |
| Brainstorming Solutions | - | ||
| Analogy | - | - | |
| Anti-Solution | - | - | |
| Brain-Writing | - | - | |
| Chanelling | - | - | |
| Improve Phase: Common Challenges | - | - | |
| SCAMPER | - | - | |
| Reverse Thinking | - | - | |
| Random Word Association | - | - | |
| Analogies and Methaphors | - | - | |
| 5S | - | ||
| Future State Map | - | - | |
| Gantt Chart | - | - | |
| Solution Selection Matrix | - | - | |
| Mistake-Proofing (Poka-yoke) | - | - | |
| Visual Management | - | - | |
| Quick Wins | - | ||
| Pilot the Solution | - | ||
| Implementation Plan | |||
| Verification | - | - | |
| Leadership | - | - | |
| Ethical Efficiency | - | - |
| Pricing | Yellow Belt | Green Belt | Black Belt |
|---|---|---|---|
| Monitoring & Response Plan | - | - | |
| Quality Mapping | - | - | |
| RACI Matrix | - | - | |
| Project Handoff | - | ||
| Project Summary | - | ||
| Innovation Transfer | - | - | |
| Leadership | - | - | |
| Ethical Efficiency | - | - |
Join over 600k people who are improving efficiency with Lean Six Sigma.
✔ No credit card required ✔ Start training immediately ✔ Full access to all platform features
