Ready to start improving processes?

✔ 14-day free trial      ✔ No credit card required      ✔ Start training immediately

logotype

sigmaxl

What’s A Sampling Calculation (Continuous)? Sampling is a measurement technique where smaller amounts of representative data can be used to understand the larger population. The

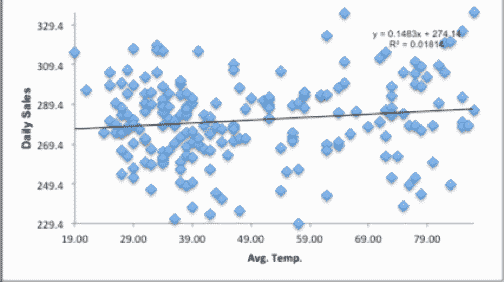
What’s A Regression Test? The Regression Test is a hypothesis test that determines whether there is a correlation between two paired sets of continuous data.

What’s A P Chart? P Charts are Control Charts designed for tracking the proportion defective for discrete data.These charts require both the total population as

What’s A One Proportion Test? The One Proportion test is a hypothesis test that can be used to determine whether a process is performing at

What’s A nP Chart? nP Charts are Control Charts designed for tracking the number of defective items for discrete data in consistently sized sub-groups. A

What’s A Normality Test? AKA Anderson Darling-Test For Normality The Normality Test is a statistical test that determines whether or not a data set is

What’s A C Chart? C Charts are Control Charts designed for tracking the count of defects for discrete data in consistently sized sub-groups. A classic

What’s An I & MR Chart (aka X & MR or Chart)? I & MR Charts are Control Charts designed for tracking single points of continuous

What’s A Chi-Square Test? The Chi-Square Test is a hypothesis test that determines whether a statistically significant difference (aka variance) exists between two or more independent

We use SigmaXL and Minitab for our Black Belt Training & Certification course. SigmaXL is compatible with Macs and PCs. Minitab is compatible with PCs

No post found.