
A process map is an important part of any Lean Six Sigma project – it helps communicate the process at the center of your project and guides you to specific areas of focus. There are a number of choices available, and choosing the right map helps to clarify your efforts.
The wrong map might confuse matters or simply waste your time. I’ll share key aspects of the following map types:
- SIPOC (and SIPOC-R)
- High Level Map
- Detailed Map
- Swimlane Map
- Relationship Map
- Value Stream Map
The intent is to help you make a useful choice, but not go into how to build each map. If you Google each map name you’ll find examples and guides for constructing them and there are links to helpful templates for some of them. Keep in mind that there are plenty of opinions on the “right” way to make them – find what works for you.
Map #1: SIPOC
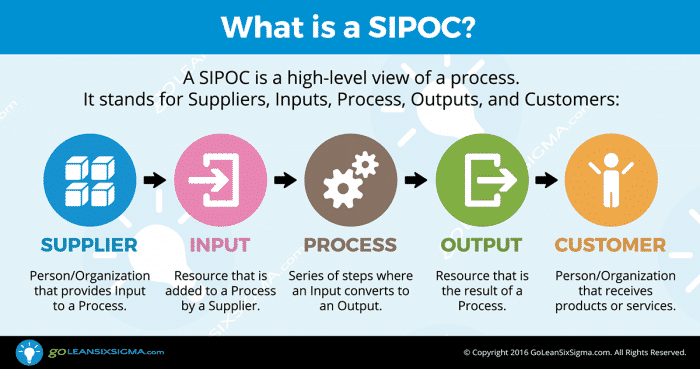
SIPOC is an acronym for Supplier – Inputs – Process – Outputs – Customer, and may not be considered a true process map by a purist. I like to think of it as a “one box” process map. That might not seem like much of a map, but it establishes the basis for subsequent mapping.
The importance of the SIPOC is that it shows, in very simple terms, what the process accomplishes while identifying the key players. The center contains the a few high-level process steps. The required inputs (and their providers) are listed to the left, and the key process outputs (and their recipients) are listed to the right. The SIPOC provides a focus for discussion of what the process is all about.
The importance of the SIPOC is that it shows, in very simple terms, what the process accomplishes while identifying the key players.
In this case we are examining the purchasing process in which a requester submits a purchase requisition that details what’s to be purchased. The requisition is received and a purchase order is issued to a supplier, who subsequently delivers what was ordered. The SIPOC also can define the scope of the project: in this case, the process of converting a request into an order placed with the supplier. It does not include the actual delivery, the invoicing or the payment. The SIPOC would have different outputs or customers if the project had a broader scope.
I recommend creating a SIPOC for every project because they are helpful when discussing the process with others and they’re incredibly simple to make! Your first SIPOC may feel a bit awkward, but with a little practice you can make a SIPOC for nearly any process in less than five minutes.
The SIPOC discussed here is the simplest form – there have been many improvements, including the SIPOC-R (discussed next), and the GoLeanSixSigma version, which actually combines the SIPOC with a high level process map (see https://goleansixsigma.com/sipoc/).
SIPOC-R
The SIPOC-R is a variation on the SIPOC in which the requirements (or specifications) for the inputs and outputs are listed, typically just under each input or output. In this case, a proper requisition might include the item description, date needed, an account number to charge, and an authorizing signature. Often the additional detail provided by requirements offers clues to problems we might wish to solve. If the problem exists even though all of the input requirements have been satisfied, then the cause is either in the process itself or in a missing (unstated) requirement. On the other hand, if the requirement has not been met, we should investigate the causes and you may not need to delve into the process details.
If we need to examine the process, we want to make sure we see how the process converts the SIPOC inputs into the outputs, so the SIPOC can help us avoid missing some important relationships.
Map #2: High Level Process Map
High Level Process Maps show how the process works in just a few steps. The purpose is to provide quick and easy insights into what the process does, without getting into the details of how it’s done. This can be useful when communicating to leadership and others who have no need (or interest) in seeing the details.
High Level Maps typically don’t require a deep knowledge of the process, so you can often construct them with the assistance of managers. Think of the High Level Map as simply an expansion of the center “process” from the SIPOC into five to ten more detailed boxes. This map shows where all the inputs go, and where all the outputs are created.
High Level Maps typically don’t require a deep knowledge of the process, so you can often construct them with the assistance of managers.
In this case, each function or department is shown in a different color. This isn’t essential, but it’s useful. In most projects a High Level Process Map is adequate to describe the process. As you investigate underlying problems, you can put marks next to the steps (dot’s, x’s, stars) when you find problems originating in that step. When complete, it forms a visual concentration diagram, showing where the problems lie in the process.
Map #3: Detailed Process Map

We don’t normally need to see the entire process in detail, but there may be some parts of the process that require a Detailed Process Map. This is especially true if there are a number of problems with that step. In this example, we might be interested in exploring the Purchasing step. We simply consider the input to that step, identify what immediately happens with that input and then repeatedly ask the “what happens next?” question until we produce the output. If this provides the necessary level of detail, we can stop here. If, however, we need to know more about the “Get three quotes” part of the process, we could explode it into more detail. The key is selectively diving into the detail. It’s a lot of work to create a detailed process map – you need to talk to the people who work the process in order to find out what really happens – managers often don’t know the process at this level of detail. I prefer to start with a High Level Map and let the needs of the project dictate when to go into more detail and how far to dive down.
The exception is if we intend to radically streamline the process. In that case we have to get close to the “work instruction” level of detail in order to isolate the few nuggets of the process that are truly value-added.
The exception is if we intend to radically streamline the process.
Finding value-added activities in a process cannot be done in a High Level Process Map. In fact, if the value-added activity is evenly distributed throughout the process, then at a high level, all of the steps will appear to be value-added because they all contain an activity that contributes value. If you blow up each step into its detail you will find that the true value-added activity is isolated in one or two small steps.Finding value-added activities in a process cannot be done in a High Level Process Map. In fact, if the value-added activity is evenly distributed throughout the process, then at a high level, all of the steps will appear to be value-added because they all contain an activity that contributes value. If you blow up each step into its detail you will find that the true value-added activity is isolated in one or two small steps.Finding value-added activities in a process cannot be done in a High Level Process Map. In fact, if the value-added activity is evenly distributed throughout the process, then at a high level, all of the steps will appear to be value-added because they all contain an activity that contributes value. If you blow up each step into its detail you will find that the true value-added activity is isolated in one or two small steps.
Map #4: Swimlane Map
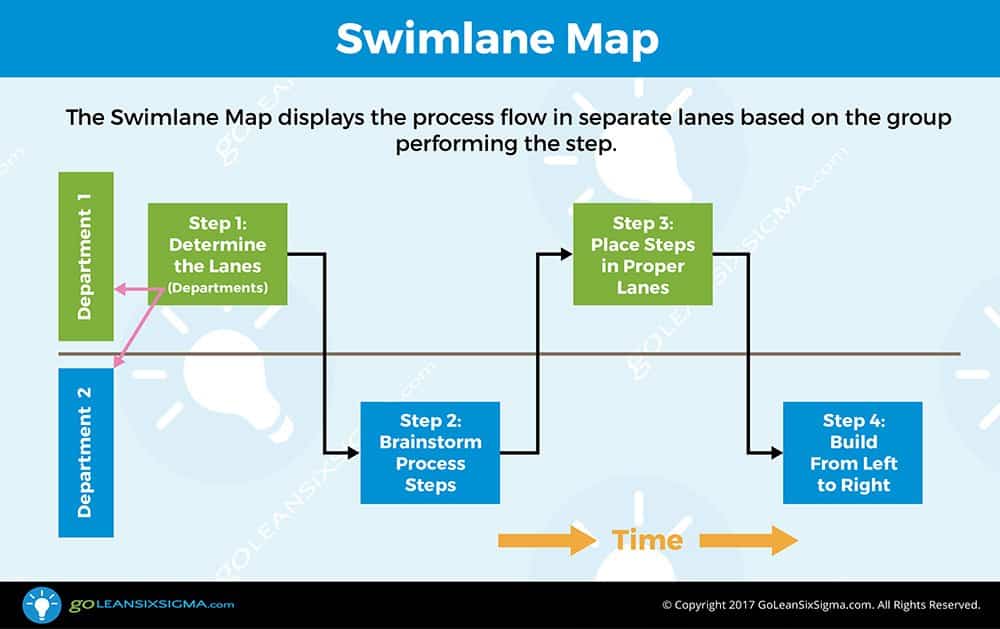
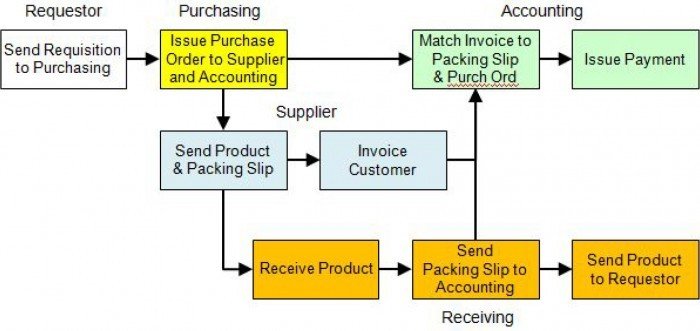
Swimlane Maps separate the steps into lanes or channels according to who does the activity. If we have a process map where the participants have been identified by departmental colors, simply “sliding” the steps so those of the same color line up in a horizontal row, it becomes a Swimlane Map.

This Swimlane Map is especially helpful when establishing work instructions and training for the new process because it makes each participant’s role explicit.
This style of process map is highly valued because it clearly shows “who does what,” when they do it and an arrow crossing a lane indicates, a handoff. For this reason, Swimlane Maps are favored by managers who who appreciate additional information. The drawback is that Swimlane Maps are not space efficient, especially if there are multiple lanes with few steps. In such maps some lanes are nearly empty which means the overall process map takes up more space. In addition, processes with a lot of handoffs can be awkward to depict in a Swimlane Map since they result in many arrows crossing multiple lanes. My preference is to use traditional, high level and detailed maps during the project work, and use the Swimlane Maps for the improved process since it will be simpler with fewer boxes, participants and handoffs. This Swimlane Map is especially helpful when establishing work instructions and training for the new process because it makes each participant’s role explicit.
Map #5: Relationship Map
Relationship Maps are technically not process maps since they don’t detail the work done, but they do show the participants and how materials, paper or information flows between them. This map was popularized by Rummler-Brache, and is not widely used, but I wanted to share it as an option. This map is useful when initially exploring the process, typically at a high level, to determine the identity of participants.

If there are only a couple of participants in the process there is no point in creating a Relationship Map, but if there are many participants it is a helpful addition to a High Level Process Map. Once you have created a Relationship Map, you can use it to complete your process map by confirming that the arrows in the Relationship Map originate from the steps creating the unit and end in the proper place.
Map #6: Value Stream Map
Value Stream Maps are typically used in Lean applications where we are interested in either showing pull scheduling or opportunities to do pull scheduling. They are often detailed and difficult to read. However, they are rich with information that is useful when planning process improvements. Value Stream Maps are often used when planning a Lean implementation to display the current state of the process including material flows, information flows and other information important for Lean implementations.

A few distinguishing features:
- Material moves from left to right
- Information which triggers release of materials or scheduling of production moves from right to left
- Work-in-Process (WIP) is shown in the triangles
- Relevant process details such as cycle time, changeover time, etc. are shown below each process step
- Wait time and work time appear on a line at the bottom of the map
- Improvement opportunities appear as starbursts
They require more skill to build than simpler process maps, but they provide great information.
Value Stream Maps are sometimes called Material and Information Flow Diagrams. They require more skill to build than simpler process maps, but they provide great information. For this process, the diagram shows there is essentially neither pull nor flow, a little over a day’s worth of work-in-process inventory and lots of wait time. The process should produce one part every 18 minutes (takt time) to meet the customer demand, but four of the five process steps cannot meet this output pace. It takes 6.56 days for a part to get through the process (though it’s needed in 5 days), after receiving 108 minutes of work. An experienced Lean practitioner will quickly see a lot of opportunity here!
Choosing the Right Map
It may seem that I am advocating the Value Stream Map, but I am not. For Lean implementations it is helpful, but for routine problem solving it may be substantial overkill. So how do we choose the right map for the job? The following chart provides guidance:

Many projects make use of several maps types. You might start out with a SIPOC, followed by a High Level Map. After some investigation you might decide to make a detailed map of selective portions of the areas where problems exist. After finding root causes and creating a revised process, the Swimlane Map can provide helpful documentation.
Use the maps to tell a story or to make reality visible to you – let the needs of the project dictate the map you choose!
