✔ 14-day free trial ✔ No credit card required ✔ Start training immediately
Annual Plan: $499 / year
Annual Plan: $17,499 / year($349.98/seat/year)Monthly Plan: $1,999 / month($39.98/seat/month)
Home » Minitab
We offer a 1-year license to Minitab for $599. If this interests you, please contact us for more information. However, we recommend using SigmaXL (a
Here are our top picks for Lean Six Sigma success stories and news from around the web for the week of May 30, 2016. The Taylor
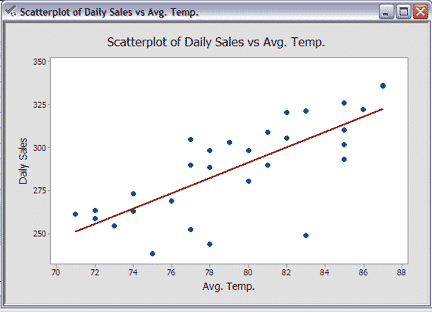
What’s a Scatter Plot? A Scatter Plot is a chart that shows the relationship between two variables (if any). A Scatter Plot is also known
What is a Run Chart? A Run chart is a graph that displays data in sequence over time. This kind of chart can display continuous or
What’s a Pareto Chart? A Pareto Chart is a quality chart of discrete data that helps identify the most significant types of defect occurrences. It
What’s a Histogram? Histograms are frequency charts. In Lean Six Sigma, they show the distribution of values produced by a process. In other words, a
What’s a Box Plot? A Box Plot is a graphical view of a data set which involves a center box containing 50% of the data
What’s Design of Experiments – Full Factorial in Minitab? DOE, or Design of Experiments is an active method of manipulating a process as opposed to
What’s Design of Experiments – Two Factorial in Minitab? DOE, or Design of Experiments is an active method of manipulating a process as opposed to
What’s Design of Experiments (DOE) – One Factor at a Time (OFAT)? DOE, or Design of Experiments is an active method of manipulating a process
No post found.