✔ 14-day free trial ✔ No credit card required ✔ Start training immediately
Annual Plan: $499 / year
Annual Plan: $17,499 / year($349.98/seat/year)Monthly Plan: $1,999 / month($39.98/seat/month)
Home » black belt » Page 3
The majority of questions around statistics require you to understand the formulas and their purpose as opposed to run calculations. Less than 1% of the
Facts and data are the hallmark of good problem solving – but all too often we don’t have enough data or the right kind of
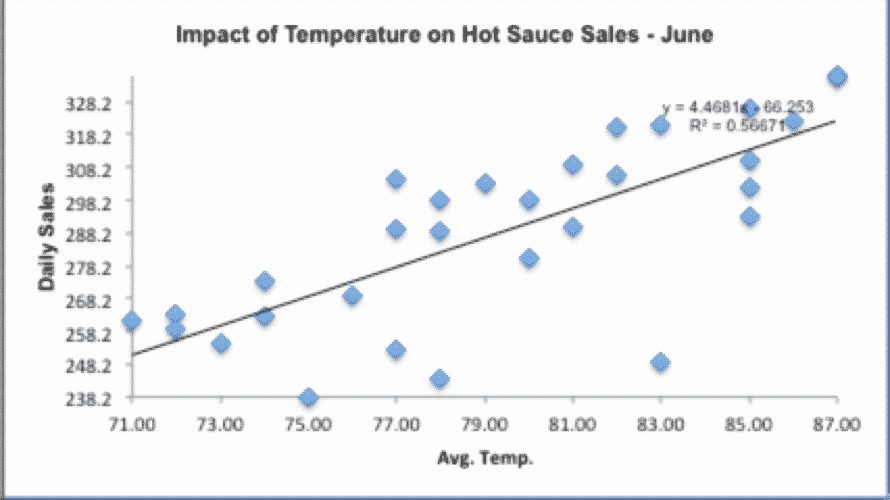
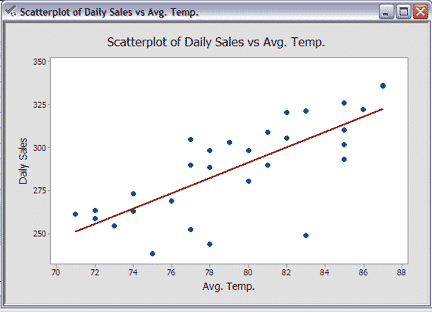
What’s A Scatter Plot? A Scatter Plot is a chart that shows the relationship between two variables (if any). A Scatter Plot is also known
What’s a Scatter Plot? A Scatter Plot is a chart that shows the relationship between two variables (if any). A Scatter Plot is also known
What is a Run Chart? A Run chart is a graph that displays data in sequence over time. This kind of chart can display continuous or
What’s A Pareto Chart? A Pareto Chart is a quality chart of discrete data that helps identify the most significant types of defect occurrences. It
What’s a Pareto Chart? A Pareto Chart is a quality chart of discrete data that helps identify the most significant types of defect occurrences. It
What’s a Histogram? Histograms are frequency charts. In Lean Six Sigma, they show the distribution of values produced by a process. In other words, a
No post found.