This guide provides best practices for submitting your Black Belt Project Storyboard. It will help prepare you to become a certified GoLeanSixSigma.com Black Belt by
As a requirement, your Green Belt Certificate must: Be issued by a regionally accredited higher education institution or ASQ Indicate that it is a Lean
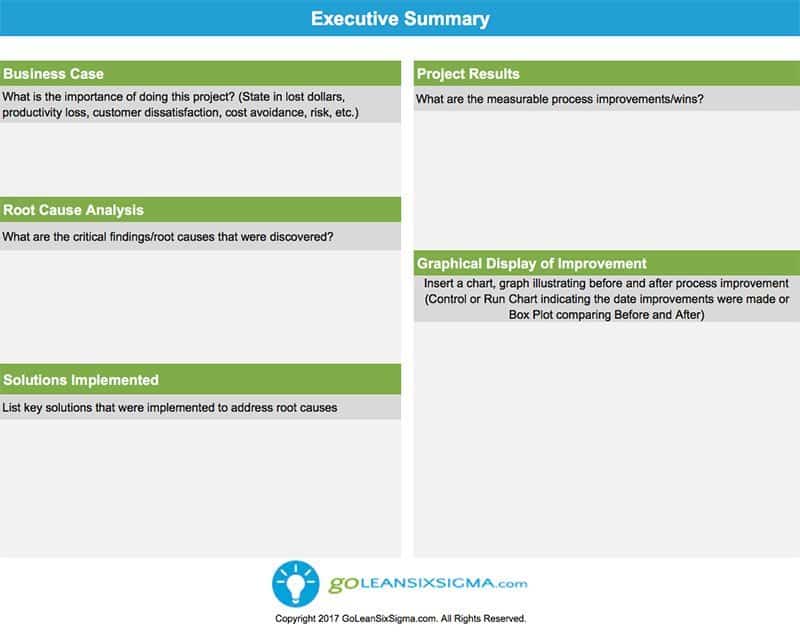
summary Summary Template What is an Executive Summary? The Executive Summary is an overview of a Lean Six Sigma project for leadership review which highlights
summary Summary Template What is a Project Storyboard? Project Storyboards are ready-to-go project overviews. They communicate a success story of process improvement projects and highlight
What’s Design Of Experiments – Full Factorial? DOE, or Design of Experiments is an active method of manipulating a process as opposed to passively observing a