skip to Main Content
Lean Six Sigma Q&A - GoLeanSixSigma.com

Which is the best chart to prove capability – Histogram or I-MR?

That’s a great question. For capability, I’d go with the Histogram. It’s easy to add the customer requirements to the graph and get a visual on how many times the process fails to meet the specifications. The I-MR Chart is a Control Chart, so it provides a visual on whether there is special cause variation. The Histogram…
This post is only available to members.
Read more
Lean Six Sigma Glossary - GoLeanSixSigma.com

Mode

The Mode is the most frequently occurring value in a given data set. In a Histogram it appears as the tallest bar. The mode is a measure of "central tendency" in a data set. For a better understanding of Mode and an overview of Lean Six Sigma, check out our…

Read more
Today’s Top 7 (or 8…) Quality Tools - GoLeanSixSigma.com

Today’s Top 7 (or 8…) Quality Tools

Traditionally, everyone in the process improvement world references the Seven Basic Quality Tools which were promoted by Dr. Kaoru Ishikawa back in the 1950s. Dr. Ishikawa was influenced by Dr. Deming, another quality great, and these are still a very good set of quality tools. But times have changed and…

Read more

How to Create a Histogram in SigmaXL

What's a Histogram? Histograms are frequency charts. In Lean Six Sigma, they show the distribution of values produced by a process. In other words, a histogram is a visual display of how much variation exists in a process. Learn more about Histograms in Green Belt Training. How to Create a Histogram in SigmaXL Download the…

Read more

How to Create a Histogram in Minitab

What's a Histogram? Histograms are frequency charts. In Lean Six Sigma, they show the distribution of values produced by a process. In other words, a histogram is a visual display of how much variation exists in a process. Learn more about Histograms in Green Belt Training. How to Create a Histogram in Minitab Download the…

Read more
Lean Six Sigma Q&A - GoLeanSixSigma.com

What are the best Six Sigma Methodologies to use in mortgage banking and where can I find the tools to help me perform them?

The nice thing about process improvement tools, is that many concepts and tools can apply to any industry, whether it is manufacturing or transactional-service related. As a matter of fact, there are many financial service companies that have applied Six Sigma in their mortgage processes, such as Bank of America, Wells Fargo, Union Bank, and…
This post is only available to members.
Read more
Histogram - GoLeanSixSigma.com

Histogram

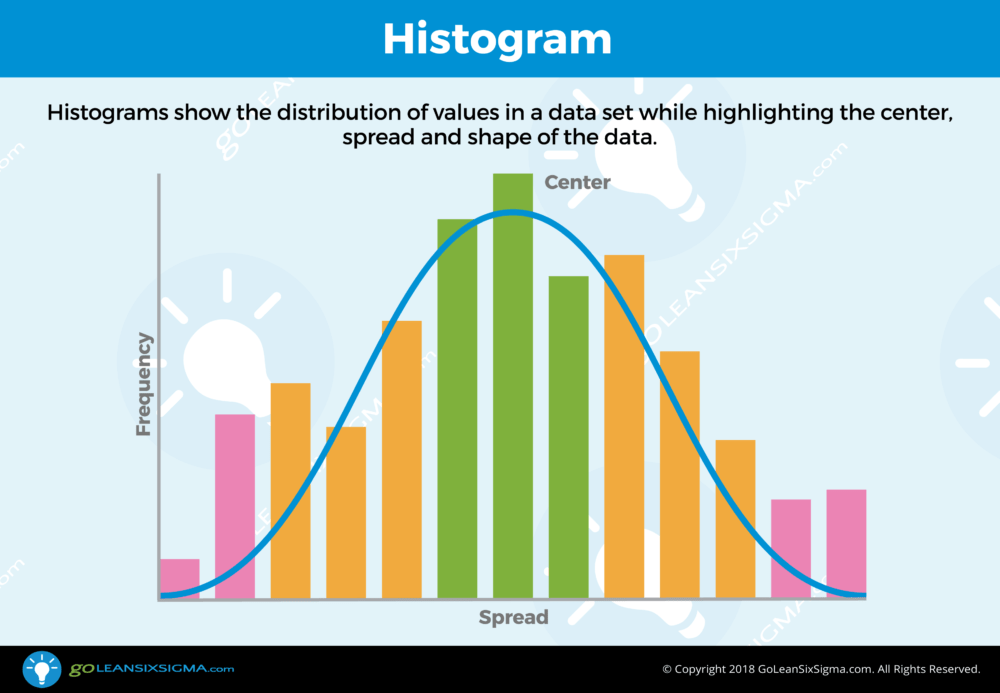
Histograms, also known as Frequency Plots, are a are visual displays of how much variation exists in a process. They highlight the center of the data measured as the mean, median and mode. They highlight the distribution of the data measured as the range and standard deviation and the shape…

Read more
Cart
Search