What’s a Mann-Whitney Test? The Mann-Whitney Test is a hypothesis test that determines whether a statistically significant difference exists between the medians of two independent sets
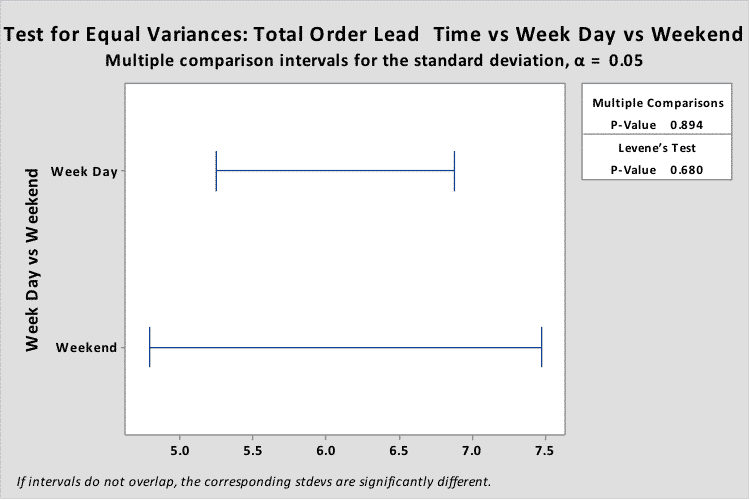
What’s a Levene’s Test? Levene’s Test is a hypothesis test that determines whether a statistically significant difference exists between the variance of two or more
What’s a Bartlett’s Test? Bartlett’s Test is a hypothesis test that determines whether a statistically significant difference exists between the variances of two or more
What’s a Historical Parameter? Historical Parameters are measurements that refer to baseline data. With Control Charts, these are often used in order to display the
What’s a Multiple Regression Test? The Multiple Regression Test is a hypothesis test that determines whether there is a correlation between two or more values
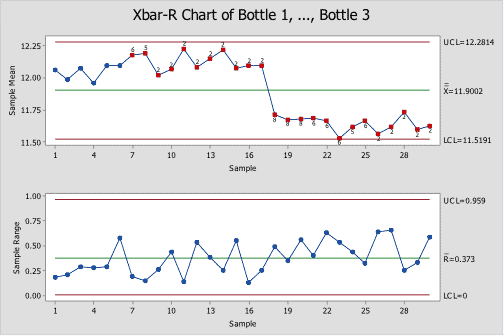
What’s an X-Bar & R Chart? X-Bar & R Charts are Control Charts designed for tracking the average of sub-grouped continuous data. They consist of two separate
What’s a Sampling Calculation (Discrete)? Sampling is a measurement technique where smaller amounts of representative data can be used to understand the larger population. The