UC San Diego Reduced Training Preparation Time By 72% With GLSS
Home » Case Study » UC San Diego Reduced Training Preparation Time By 72% With GLSS
California
Education
Education
72%
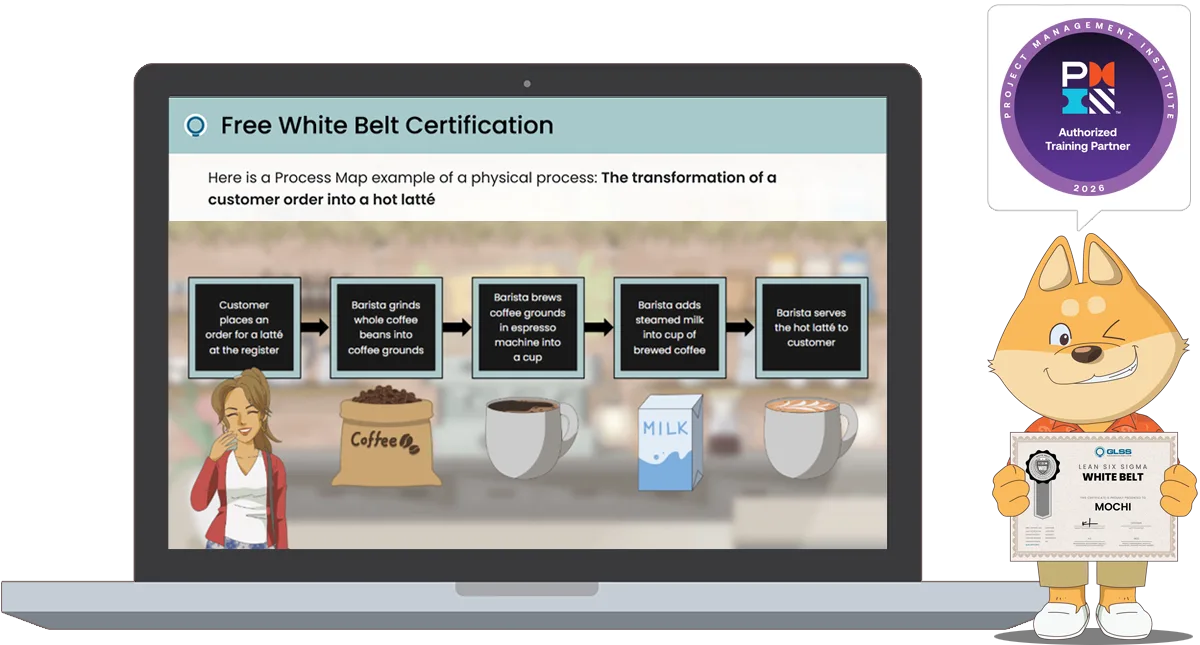
UC San Diego is implementing Lean Six Sigma. Find out how this project team reduced waste on training preparation time for their internally delivered Yellow Belt training course. UC San Diego is implementing Lean Six Sigma on Lean Six Sigma!
Matt Helton is a Strategic Initiatives Analyst for the Office of Operational Strategic Initiatives or OSI. His primary role is managing the department project portfolio, providing operational and project support, coordinating and facilitating Lean Six Sigma staff training at UC San Diego. He recently became a Lean Six Sigma Green Belt certified through the UC San Diego Extension Program.
Lynn Underwood is an IT Service Manager in the Service Management Office at UC San Diego. Lynn is PMP Certified, a Process Design Engineer and, like Matt, recently became a Lean Six Sigma Green Belt certified through the UC San Diego Extension Program.
THE CHALLENGE
UC San Diego is the number 1 Public University in the country, but that doesn’t mean they can’t do better. The University has a robust program for educating their own staff on Process Improvement at a Yellow Belt Level. But the prep process for conducting the training took about as long as the training itself! Facilitators complained about how long they had to spend preparing to conduct the full-day simulation for University Staff. University Management didn’t want to lose so many hours of valuable staff time to non-value-added activities. This presented an opportunity to apply Lean Six Sigma to a Lean Six Sigma class.
IT Service Manager Lynn Underwood and Strategic Initiatives Analyst Matt Helton teamed up to tackle the problem as part of their Green Belt Certification at the University. The first thing tackled was measuring how long it took to prepare for the Yellow Belt Certification. After measuring the end-to-end prep time for nine separate Yellow Belt Classes, they found it ranged from 6 to 8 hours and averaged about 7 hours. Their Sponsor, Senior Director of Strategic Initiatives Ashley Gambier, challenged them to reduce the cycle time by at least 50%.
THE DISCOVERY
Mapping the process made it clear how many steps were involved in the process. Adding average cycle times to each step illuminated where the biggest bottlenecks too place:
- Clean Laminate Materials—120 minutes
- Organize laminate materials by job—60 minutes
- Laminate all new materials—60 minutes
- Binder clip & bundle laminate materials—90 minutes
“As Is” Process Map of Simulation Preparation
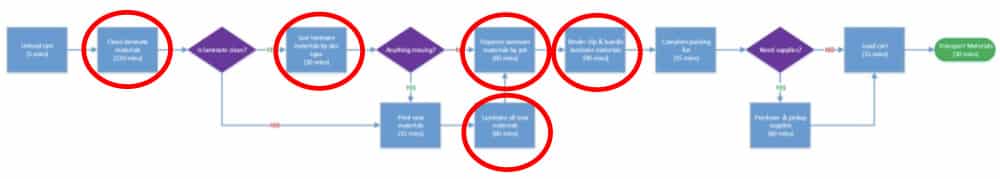
Steps having to do with anything “laminated” took 5 and a half hours. After discoveries like this, the team put together a Fishbone Diagram. Even though they brainstormed remotely, they uncovered a wealth of potential root causes to test.
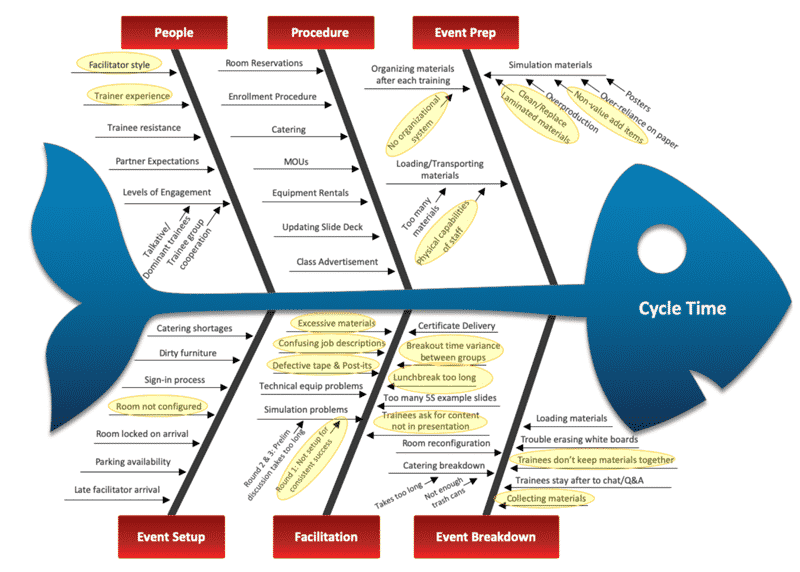
Since the goal was to reduce prep time they focused their root cause verification efforts on that segment of the process. The root causes they narrowed down were:
- Simulation materials were scattered all over the room at the end of a training day which increased the time it took to reorganize the materials for the next class
- It was hard to remove ink from the laminated materials so the clean up of the laminated materials was a major time drain
- There were a lot of unused and therefore non-value-added materials included in the simulation which increased the time it took to prep for subsequent simulations
THE IMPROVEMENTS
As a result of all the opportunities they uncovered, Lynn and Matt were able to reduce the prep time from a baseline average of 7 hours to an average of just under 2 hours. They did better than a 50 % reduction, they got a 72% cycle time reduction! Some of the changes included:
- Printing log sheets instead of using laminated log sheets, reducing the quantity of laminated materials that require cleaning after each simulation
- Creating inventory checklist for simulation materials
- Implementing accordion files for organizing simulation materials
- Implementing binder rings to keep simulation materials together
- Asking trainees to put simulation materials back at the end of each class
- Creating a Supplies Inventory Checklist & using it to replenish ahead of time (no last minute needs)
The Improved Prep Process Map
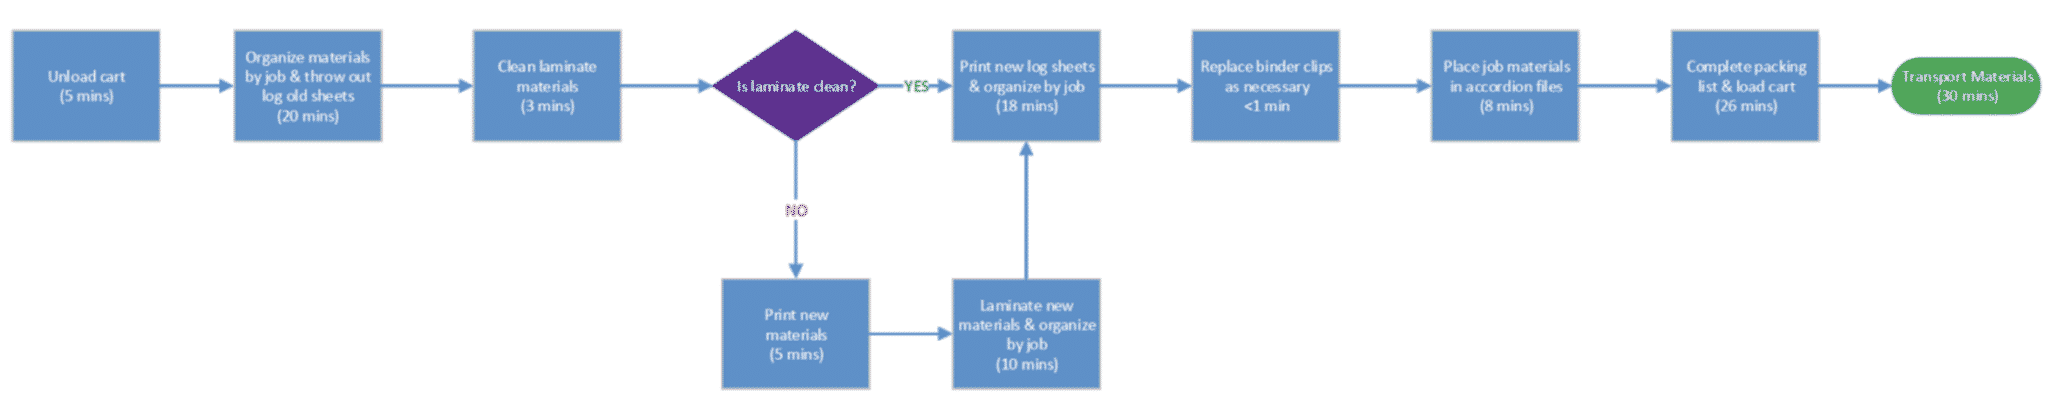
There were fewer steps in the process since they were able to remove 2 inspection loops for missing materials at both the beginning and the end of the process. There were big drops in cycle time for the preparation steps across the board. The class facilitators, a key Stakeholder group, got back 5 hours of valuable time—time they could now spend adding value and using their skills where they counted.
They achieved a huge improvement in prep time, and they also managed to lower the cost of supplies at the same time. A summary of their gains is listed below:
- Reduced event prep cycle time by ~5 hours (72%)
- Reduced cost associated with each event prep (including cycle time, staffing resources & material costs) from $1,085 to $142 (87%)
- Annualized event prep savings of $49,036 (based on one iteration/week)
- Annualized training event savings of $83,252 (based on one iteration/week)
What’s Next?
As newly certified Green Belts, Lynn and Matt are off to their next projects. They are both appreciative of the DMAIC process noting that in the past, they would typically skip both the Measure and Analyze Phases and skip right to Improve. But during the project, collecting data helped them challenge their assumptions. It prevented them from jumping to unfounded conclusions about problems because they could test their theories and back them up with data.
The experience confirmed for the two of them that the Lean Six Sigma method is accessible to everyone. They didn’t have to deal with “crazy equations and confusing data configurations” to achieve their goals. They noted that most of the information on their Fishbone was based on verbatim comments from process participants. But it helped them to understand the process. They both valued the discipline of asking why, why, why why—and why again to get to the root causes of problems. They are looking forward to more opportunities to educate others and collaborate to build great processes at UC San Diego—and keep them ranked #1!
The Improved Prep Process Map
There were fewer steps in the process since they were able to remove 2 inspection loops for missing materials at both the beginning and the end of the process. There were big drops in cycle time for the preparation steps across the board. The class facilitators, a key Stakeholder group, got back 5 hours of valuable time—time they could now spend adding value and using their skills where they counted.
They achieved a huge improvement in prep time, and they also managed to lower the cost of supplies at the same time. A summary of their gains is listed below:
- Reduced event prep cycle time by ~5 hours (72%)
- Reduced cost associated with each event prep (including cycle time, staffing resources & material costs) from $1,085 to $142 (87%)
- Annualized event prep savings of $49,036 (based on one iteration/week)
- Annualized training event savings of $83,252 (based on one iteration/week)
View Slides