Synovus Reduced Underwriting Resubmits By 20% With GLSS
Home » Case Study » Synovus Reduced Underwriting Resubmits By 20% With GLSS
LOCATION
Georgia
INDUSTRY
Finance
FUNCTION
Finance
IMPROVEMENT
20%
Tyson’s Black Belt Project focused on reducing underwriting package defects. By using a Fishbone Diagram the team was able to test out their suspected root causes, which ultimately led them to the “ah-ha” moment of neither being statistically significant!
What do you do when all of your root causes prove to be false? You go back and look for more which is what Tyson did. The red dots on the Fishbone Diagram suggested the next possible root cause, which did prove out. Nice job, Tyson, for sticking with the process and shooting right past your goal!
– Bill Eureka, GoLeanSixSigma.com Master Black Belt Coach
Tyson Simmons is an Operations Analyst Manager at Synovus and a Lean Six Sigma Black Belt. For his Black Belt project, Tyson decided to investigate why so many of their underwritten loans are resubmitted. What was the ultimate result? 20% less resubmits and 40 hours of overtime saved per month!
THE CHALLENGE
Tyson knew his resubmission rate was too high, and his team had their suspicions about what might be causing it. But like any great process improvement leader, Tyson didn’t jump to conclusions. Instead, he turned to DMAIC.
He set out with the goal to reduce the rate of loan package resubmits to less than 40%. If he could reduce the amount of resubmits, then his company would save a lot of time, money, and effort wasted on rework.
THE DISCOVERY
Tyson started by mapping his process. He created both a SIPOC and “As-is” Process Map to provide him with both a high-level and detailed view of the current underwriting process. He discovered that resubmits only occurred at two decision points at the end of the process, so he asked himself, “how many [resubmits] are getting here and can we stop [them] earlier?”
Tyson came up with a Data Collection Plan, measured their current process, and established baseline data for how their process was performing – finding 55% of underwritten loans were resubmitted for approval! Yikes!
Tyson wanted to determine where else waste lived in this process, so he performed a Value-Add Analysis for both the original underwriting and resubmission process. He found that the resubmission process contained 24% less value-add work than the first pass. What does this mean? Reduce resubmits!
The next for Tyson and his team was to determine the root cause of resubmits. Using a Fishbone Diagram, the team all agreed that analysts and bankers were the problem. Their hypothesis was that loans were resubmitted due to unfavorable results. However, when put to the Hypothesis Test, their theory fell flat. Their best guess was not a statistically significant root cause.
What do you do when all of your root causes prove to be false? You go back and look for more which is what Tyson did. The team went back to the fishbone diagram suggesting the next possible root cause, which did prove out.
The team turned their attention to the next most likely root cause of their high resubmittance rate: communication.
After surveying their analysts on the frequency of their communication with bankers, Tyson discovered that the less an analyst communicated with a banker, the more resubmits they received. The team had finally found their root cause.
THE IMPROVEMENTS
To find the best solution for this issue, Tyson used an Impact Effort Matrix and Solution Selection Matrix. He determined that the highest-impact, lowest-effort solution was to require bankers to call an analyst before submitting a loan request.
By screening loans over the phone, an analyst could prevent a banker from filing a bad request – reducing the chance of poor results and resubmits.
After developing and implementing this new process step:
Resubmits dropped by 20%
Overtime was reduced by 40 hours a month
Customers are receiving loans faster
Bankers and analysts are happier with less rework
Tyson and his team only implemented one additional step in their process, but they were able to achieve incredible results and learn valuable lessons along the way. Their biggest lesson learned? Dig deep and verify your root cause.
Thank you for leading the process improvement charge, Tyson! We can’t wait to see what you do next!
Executive Summary
Business Case
It takes anywhere from 6 to 16 hours to put together a loan underwriting package for our commercial loan group, and 55% of these submissions have to be resubmitted and reworked for one reason or another. Reducing the number of resubmits will reduce the amount of unnecessary and repetitive work, which will in turn reduce the amount of time and money it takes to complete a loan, resulting in better CX and giving the Bank a competitive advantage.
Root Cause Analysis
It was determined that many resubmits were due to unfavorable scores and bankers unaware of what scores to expect. Many of these went through the entire process and then would have to go through the entire process again. We identified a correlation between communication (phone) and resubmits.
Solutions Implemented
Created a phone queue that bankers are required to call right after submission. This call is for the expert analysts to help bankers vet loans, level set on expectations, and catch obvious resubmit causes early before fully underwriting.
Project Results
Resubmits have dropped to 20%, reducing lead time by 13 hours and cycle time by 4 for each resubmit avoided.
Graphical Display of Improvement
Key Take Away: A little bit of time upfront discussing the loan has made a clear impact on resubmits, cycle time, and rework!
Project Charter
Problem Statement
Reduce the number of unnecessary resubmits by enhancing the process and identifying solutions for the leading causes for unnecessary resubmits.
Goal Statement
Decrease the Application Resubmit rate from 55% to 40% by 12/4/2018
Scope
Process Start: Frontline submissions
Process End: Underwriting
In: Underwriting resubmits, underwriting process high-level, frontline actions and requirement, and queueing systems and tools
It takes anywhere from 6 to 16 hours to put together a loan underwriting package for our commercial loan group, and 55% of these submissions have to be resubmitted and reworked for one reason or another. Reducing the number of resubmits will reduce the amount of unnecessary and repetitive work, which will in turn reduce the amount of time and money it takes to complete a loan, resulting in better CX and giving the Bank a competitive advantage.
Timeline
Phase
Planned
Actual
Define
9/10 – 9/30
–
Measure
10/1 – 10/31
–
Analyze
11/1 – 11/16
–
Improve
11/17 – 11/30
–
Control
12/1 – 12/4
–
Team Members
Position
Person
Time Commitment
Team Lead
Peter Simmons
20%
Sponsor
Matt
10%
Team Member
Robert
20%
Team Member
Underwriters
20%
Key Take Away: Everyone is onboard and wants to process loans for our customers faster, and avoid having to follow up and request more docs.
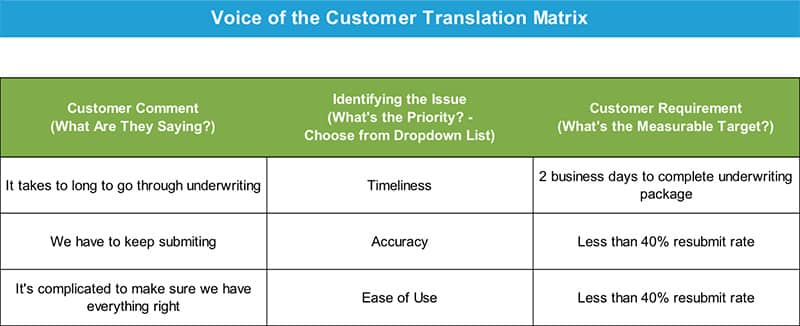
Voice of the Customer
Key Take Away: These aren’t new to the team, but reducing resubmits would help with all 3.
SIPOC
Key Take Away: The main focus of this project is on loans that need to go through this process multiple times.
As-Is Detailed Map Segment
Key Take Away: The main focus of this project is on loans that need to go through this process multiple times.
MEASURE PHASE
Data Collection Plan
Key Take Away: This grew from when we first created it, as we identified additional measures through the Analyze Phase.
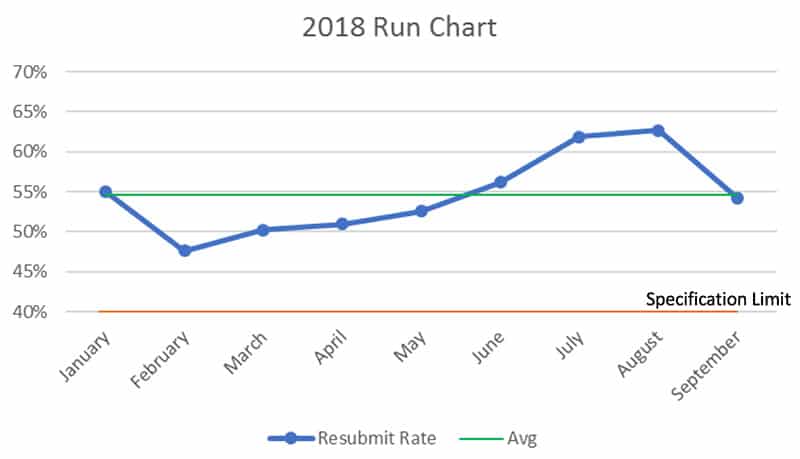
Baseline Data – Project Y
Key Take Away: This chart clearly shows the process is running well above the desired target of less than 40%. (Data before 2018 is omitted due to reliability)
Baseline Data – Resubmit Categories
Key Take Away: Reviewing the categories there are clearly a select few to focus on. This chart drove our MSA.
MSA Results
Key Take Away: Because every loan is different and the process can be done multiple ways, resulting in a resubmit for one analyst and not another, and the amount of time it takes to process a package, we did not conduct an MSA for resubmit yes or no. Instead we focused our MSA on categorizing resubmits. 12 scenarios were printed on index cards and 2 analysts were asked to categorize them to measure reproducibility. We then had them review the same cards in a different order to measure repeatability.
ANALYZE PHASE
Value-Add Analysis
Key Take Away: Our analysis showed that the value-add for resubmits is drastically lower than first pass. We need to figure out what is causing them and reduce those resubmits!
Fishbone Diagram
Key Take Away: Our fishbone had a mix of solutions in disguise, symptoms, and ideas for root cause. Affinity analysis lead us to narrow down our root causes to evaluate.
Fishbone Analysis and 5 Whys
Key Take Away: We took our possible X’s and had to categorize and make them measurable. Our 5 Whys analysis helped us reduce the number to review by identifying several x’s as symptoms of each other.
Process Flow Analysis
Key Take Away: Our current state process flow analysis highlighted two decision points at the very end that caused the whole process to repeat, how many are getting here and can we stop it earlier?
Category Stratification
Key Take Away: To test the theory that many resubmits were because of unfavorable results at the end, that could or should have been identified earlier, we recategorized and stratified the data into two categories; and we saw there was a very high percentage of resubmits that were because of unfavorable results that could of or should of been caught earlier.
Hypothesis Testing Plan
Key Take Away: The group was sure both of these were statistically significant root causes! Glad we showed with testing before fixing the wrong problem! But what now?!
Communication
Key Take Away: Since it wasn’t the bankers or the analysts, we decided to revisit the fishbone and look at communication. We surveyed the analysts and we saw there looked to be a correlation between communication and resubmits. Time to test!
Regression Analysis
Key Take Away: Although we only had 7 data points from the survey, we were able to clearly see there was a statistically significant correlation between Communication Time and Resubmit Rate!
IMPROVE PHASE
Selected Solutions
Key Take Away: The team brainstormed ideas and then scored them. We decided to pilot the only one that landed in the upper left corner.
Pre Call Pilot
Key Take Away: The Pilot Checklist really helped all stakeholders get on the same page and organized.
Implementation Plan
Key Take Away: This was important to make sure all dates, roles, and expectations were aligned with all responsible parties.
Risk Management
Key Take Away: Getting a hold of bankers was an issue lifted up through the surveys, so we wanted to make sure we had enough people available when they called; and we wanted to make sure the time to complete this process didn’t offset potential savings from avoiding resubmits.
To Be Map Segment
Key Take Away: We now have a catch at the beginning at the process to avoid completing all steps, before identifying that it doesn’t meet expectations.
Proof of Improvement
Key Take Away: There was a clear drop in resubmit rate from September compared to the pilot* and it’s below our target goal of 40%!! [Pilot dates are weeks not months and were bumped 10% higher to account for resubmits that may come in later from pilot period]
CONTROL PHASE
Monitoring & Response Plan
Key Take Away: The Monitoring Plan helped a lot by increasing the frequency of resubmit data and reviews to weekly, compared to monthly, and it put a target and response plan in place when there wasn’t one before.
X & MR Control Chart of Project Y
Key Take Away: The team has never used a control chart to monitor their process before, and the frequency is moving to weekly so that they are able to act quicker and have more data points [The above charts are simulated because timeline is short of the goal of 20 data points].
Project Closure
Lessons Learned
Remember to involve everyone early and clearly establish roles and commitments
Focus on getting good data, and if it isn’t good or doesn’t exist, find a way to measure it
Utilize hypothesis testing to make sure a root cause is a root cause
Make sure to dig into problems (5 Whys)
Customer Impact
Bankers have thanked us directly on the calls for explaining and walking them through the process and potential issues!
Final Calculations
Resubmits are down more than 20%
Overtime has dropped by 40 hours per month
Soft Savings
We have eliminated 13 hours of lead time and 4 hours of cycle time for 20% of our loans, and those savings are being applied to produce more loan packages faster
Sign-off From Project Sponsor
I would never have thought this was the root cause issue and I’m excited for our new control chart! Thank you so much for all your help! – Robert
Key Take Away: Resubmits are down and the team can now produce more higher value-add first run loan packages faster!
Key Words
Analyst – The underwriter who is reviewing the loan and documents and producing a risk rating and scorecard.
Approver – The person who determines, largely based on the risk rating and scorecard, whether the loan is good to move forward or not.
Banker – The person who is trying to get the loan for the customer. They are the go between and responsible for getting all the documents and information from the customer.
Resubmit – When a loan is assigned to the underwriting team in the system and goes through the underwriting process, but then later needs to be sent to the underwriting team again via the system.
Underwrite – Evaluating a customers cash flows, profitability, and risk, to assign a risk rating, spreads, and scores based on multiple financial documents.
AD Normality Test for Analyst Resubmits
Key Take Away: Needed to determine if data was normal so we could determine what hypothesis test we needed to conduct.
AD Normality Test for Analyst Resubmits
Key Take Away: The team thought this was a root cause, but a P value of .23 said we could not reject the null!
Bankers Are Not the Reason!
Key Take Away: The Analysts were sure the bankers were the root cause, but our Chi SQ test said otherwise, with a P value of .15!
Sample Plan Resubmit Cycle Time
Key Take Away: Lead time was readily available in the system but the team didn’t know how long the actual cycle time was to process for first pass and resubmits; so we decided to take a sample and get an idea of average time to complete. We based the std deviation on analysts estimates and had a wide margin of error because of the large variation in time and because every loan is different.
Sample Plan First Run Cycle Time
Key Take Away: Lead time was readily available in the system but the team didn’t know how long the actual cycle time was to process for first pass and resubmits; so we decided to take a sample and get an idea of average time to complete. We based the std deviation on analysts estimates and had a wide margin of error because of the large variation in time and because every loan is different.
Stakeholder Analysis
Key Take Away: This was great to build and consider especially at the beginning of the process. Helped with communication and support.
Resubmit and Category Data From Tracking Sheets
Key Take Away: This data was great but there was a lot of noise in it. The previous Manager did not track to this detail or measure the same way. We limited our info to 2018 for that reason and the last 3 months for resubmit types because of process changes and tracking changes that were recently implemented.
Lead Time Data From System
Key Take Away: We were able to get what we needed from the tracking sheets and the system data, but there is definitely room to improve on what reporting is available in the system. Going through this project has allowed us to provide additional enhancements and suggestions for the system and its reporting.
Project Storyboard
Start a free trial and get access to all GLSS courses (Yellow Belt, Green Belt, Black Belt, and more!) for only $499/year with a GLSS Subscription!