
How can you run a hypothesis test when you don’t have much data? Are you dead in the water? Luckily, no! There’s Tukey! No, not “turkey,” a gentleman by the name of John Tukey came up with a test that can help.
This is a little-publicized, incredibly useful hypothesis test that we should all know about: the Tukey End-Count Overlap Test. It is a test for non-normal data (a non-parametric test) that works with any distribution. It works with incredibly small sample sizes and it’s great for cases with substantial measurement error – even in cases where there are no measurements at all!
Sample Ranking
How can this be? This test uses the ranking of samples and can be used anywhere we can rank, including situations where we have no measure, but can rank samples through our senses alone. Let me illustrate with a simple example.
Suppose we have a process that only gets one data point per quarter. This means in six months we have two data points, A and B. Say we make an improvement and collect additional data points, C and D. Suppose our objective is to increase the values of our process. We find that both points C and D are larger than points A and B, and on that basis we would like to declare victory. “Not so fast,” you say, “you can’t reliably run a Two Sample T-Test with such small samples – you can’t even get a good estimate for standard deviation!”
The Tukey End-Count Overlap Test would say that if points C and D are both larger than points A and B, we can be 83% confident that the improvement is real. That isn’t the 95% that many people expect, but it’s pretty good for such a small sample size. I’d be willing to buy this as real enough, given the difficulty in gathering data. However, if we truly needed 95% confidence we could get it using three “before” data points and three “after,” provided all the “after” data points were higher than the “before” data points.
Sound like shenanigans? It’s not – it’s based on something called “combinatorials.” I will illustrate with a simple example and you can extrapolate the principles to larger examples. If we rank order the four samples, A, B, C and D, there are 24 possible rankings (permutations) that could occur by random chance:
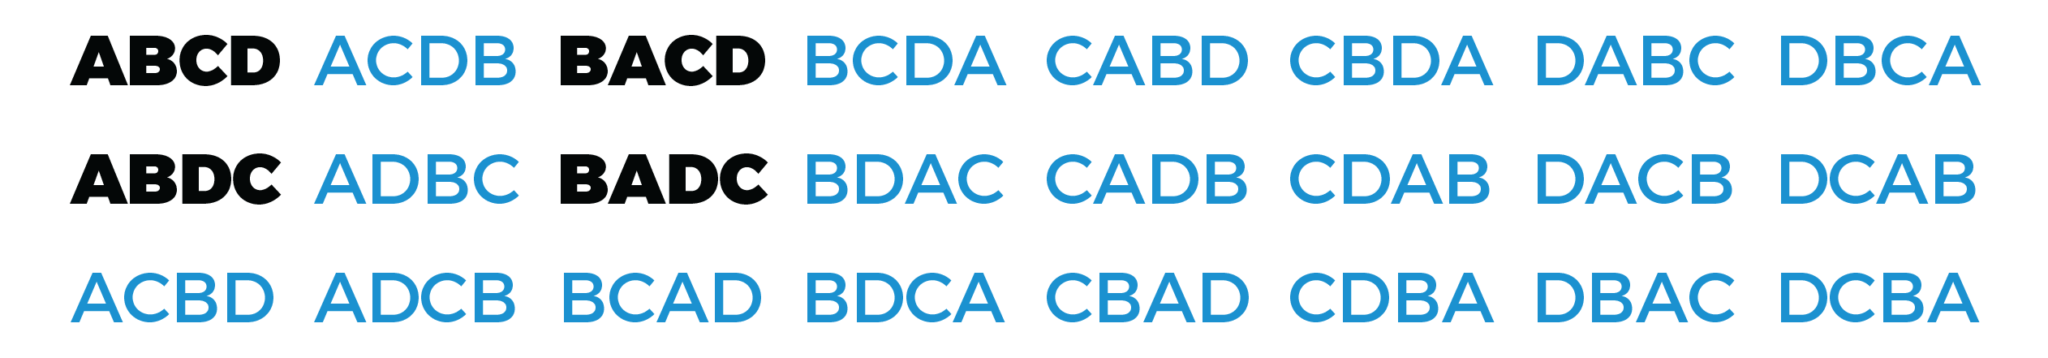
Of these 24 possible rankings, only four (shown in bold) have C and D higher that A and B, so there is a 16.7% chance that this could occur by random chance alone (sounds a lot like a p-value, doesn’t it?)
When to Use It
I mentioned earlier that this test can be used even when there is substantial measurement error. As long as we have sufficient measurement reliability to rank the data, that’s all that’s needed. In fact, there is no need to rank order every data point – as long as we can determine there’s no overlap in the ranks between the two samples, that’s quite sufficient!
You can also use this in situations where the characteristics that are difficult to quantify, such as casting porosity, paint defects, severity of bed sores or feel of hair or corrosion.
Real World Application
I recently reviewed the Green Belt Storyboard for Kyle Schmucker and Rebecca Cistaro, whose run chart is pictured below:
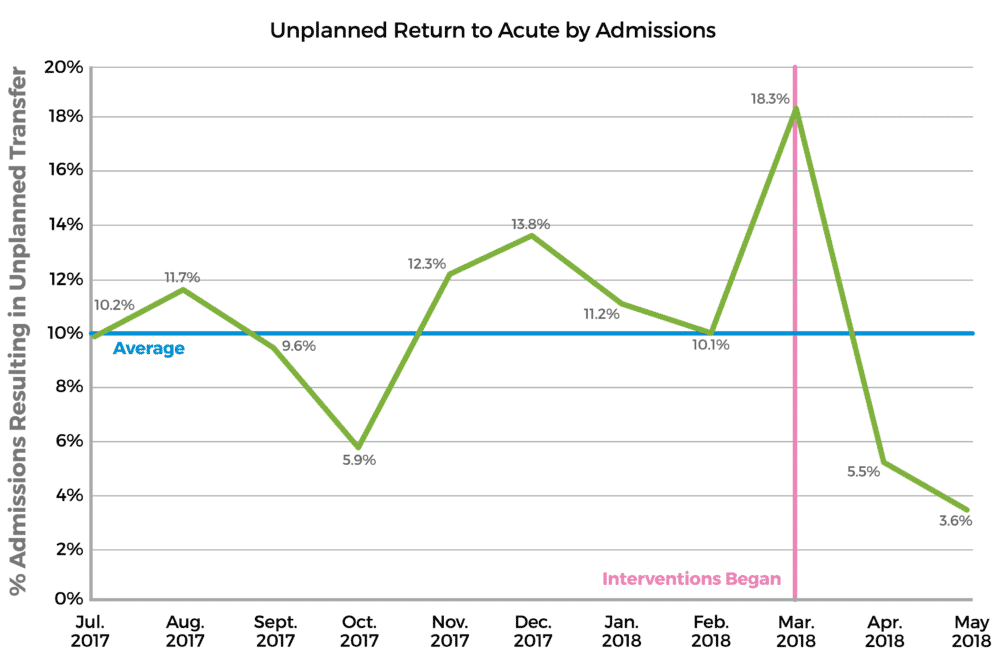
Ordinarily I would have rejected the results because there are too few data points for the new process. But as I looked closer I saw that both of the “after” data points were better than any of the baseline data points. I declared (based on experience initially), that such a situation is highly unlikely and therefore significant. I did however double-check and found that the Tukey End-Count Overlap test confirmed my conclusion. With two “after” data points clearly better than the previous nine “before” data points, we could be over 98% confident that the difference was not due to random chance.
Tukey and P-Values
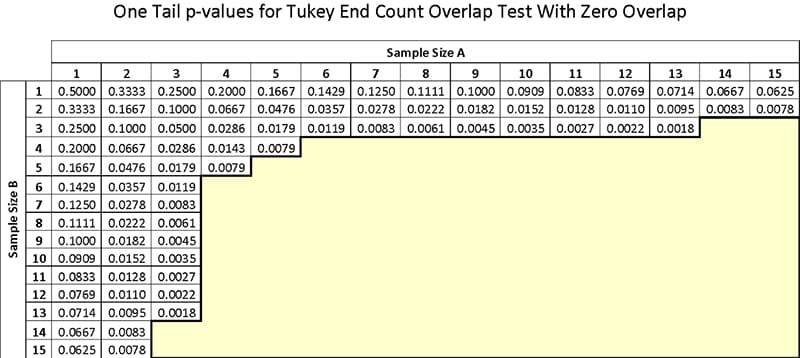
Want to try your own? Here is a chart of p-values for various sample sizes. This chart is for cases where there is no overlap of ranks between the samples. There are versions of the test that allow for some degree of overlap, but this is the simple version.
If you prefer to calculate the p-value, it can be done with this formula:
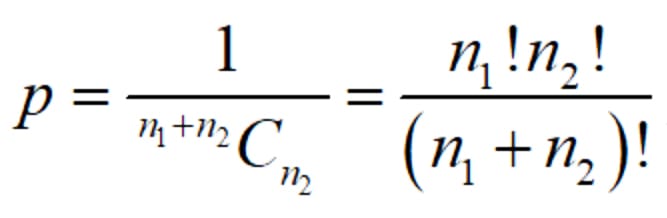
where n1 and n2 are the sample sizes, with no overlapping values. In Excel, use the 1/COMBIN(n1+n2,n2). If you prefer a more well-known hypothesis test, the two-sample Mann-Whitney test, available with Minitab and SigmaXL, gives slightly higher p-values. Both are equally acceptable, but I have a fondness for the Tukey test because I don’t need to do any computation. I simply need to remember three before and three after (with no overlap) for 95% confidence.
Thanks to Mr. Tukey
John Tukey was a prominent statistician, having made numerous contributions over the years (Wikipedia has a nice write-up on him). We’re happy to give John Tukey credit for this excellent contribution to problem-solving. He and his test are here if you need him!
