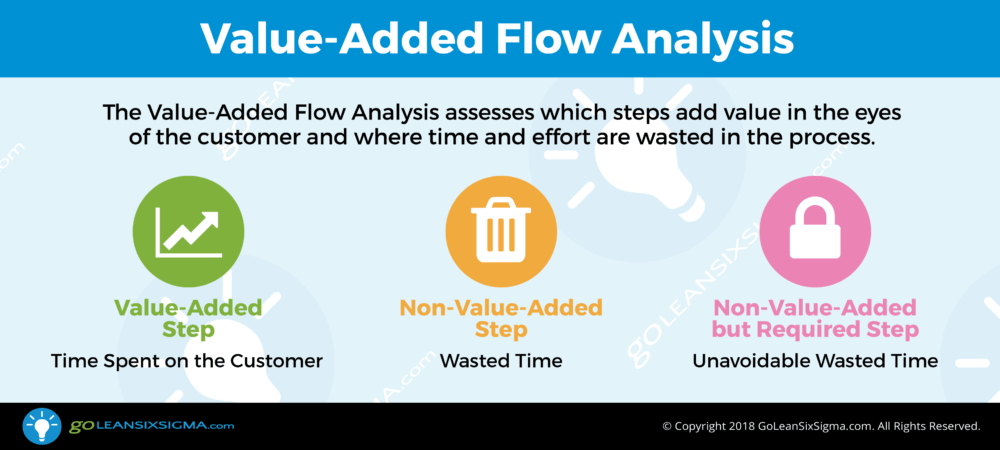
summary Summary Template What is a Value-Added Flow Analysis? Value-Added Flow Analysis combines two powerful tools into one. The Value Analysis differentiates steps that add
Cost/Benefit Analysis is a decision-making tool to compare costs (negative results) vs. benefits (positive results) of a proposed change to a process. The costs can
Continuous Improvement broadly describes ongoing, incremental efforts to improve products and processes. Continuous Improvement with Lean Six Sigma utilizes a data-driven approach and process analysis
Contingent Actions are pre-planned steps scheduled to go into effect when defects or failures occur. They are designed to minimize damage and cost due to
A Cockpit Chart is a high level, at-a-glance display of key performance indicators that are regularly monitored. Ideal for presenting to process owners, senior leadership
The Chi-Square Test is a hypothesis test that determines whether a statistically significant difference (aka variance) exists between two or more independent groups of discrete
Assumption Busting is a brainstorming and questioning technique that does two things: Identifies and challenges conventional assumptions Eliminates them if they are obstacles to optimal