Home » Template » Box Plot (aka Box and Whisker Plot)
summary
Summary
Template
What is a Box Plot (aka Box and Whisker Plot)?
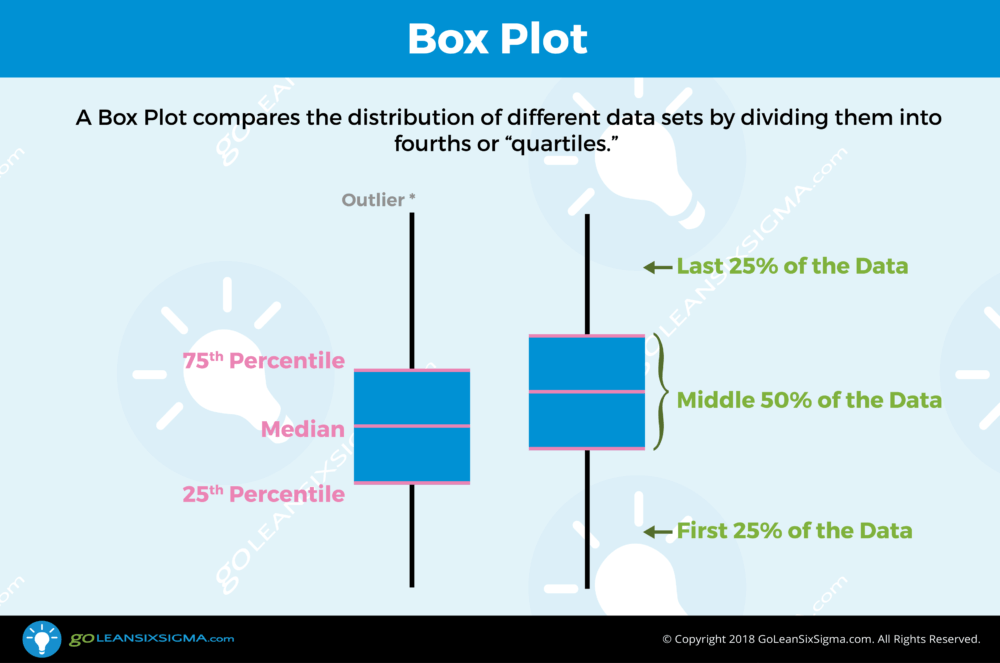
A Box Plot, or Box and Whisker Plot, is a graphical view of a data set that is divided into fourths or “quartiles.” It shows the center and spread of a data set but is most useful when comparing two or more “strata” or data sets such as the cycle time for two different departments.