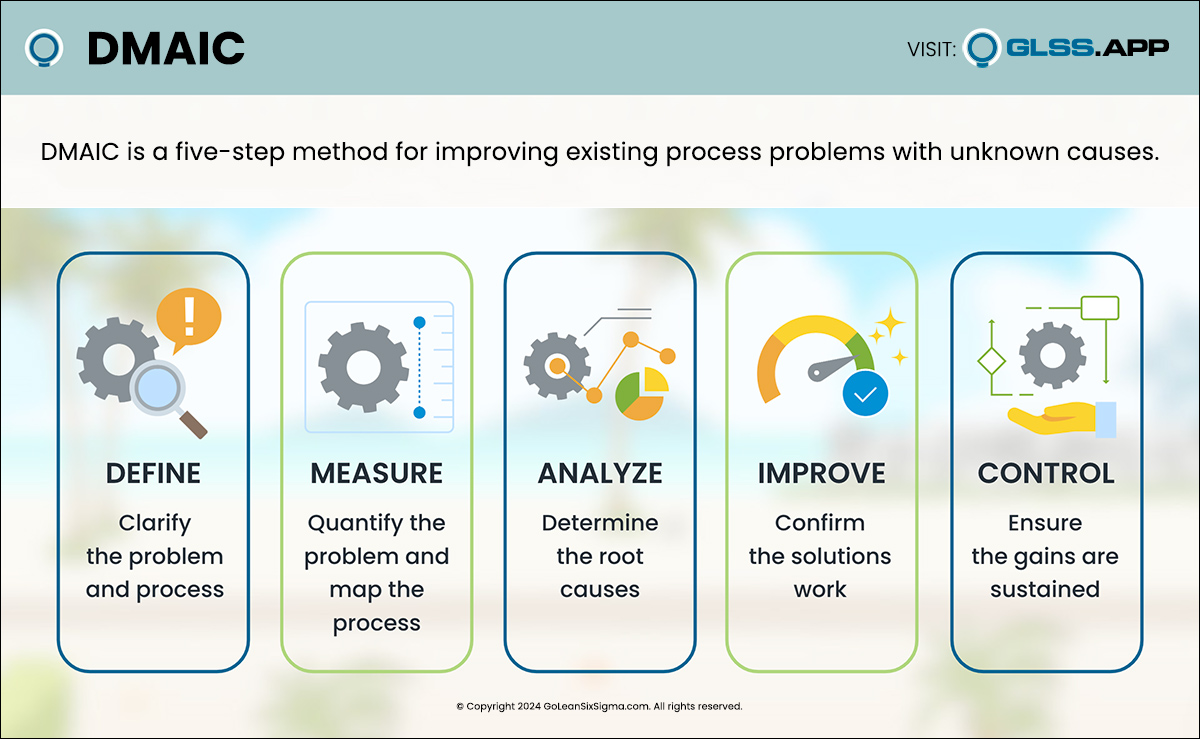
GLSS-Logo_White

glossary

summary Summary What is a Cycle Time? Cycle time is the measurement of the time elapsed from the beginning of a process or a step

...

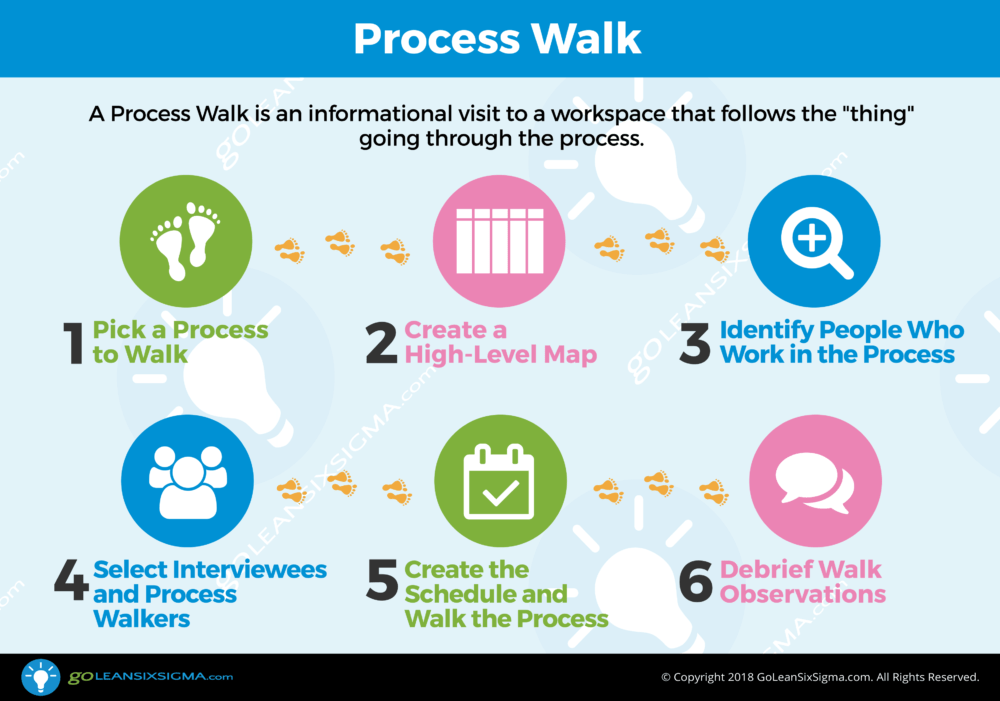
summary Summary Template What is a Process Map? A Process Map is a step-by-step diagram that shows the activities needed to complete a process. Creating

...

summary Summary Project Charter Process Walk 5 Whys What is the Yellow Belt Template Pack? The Yellow Belt Template Pack provides you with all the

...
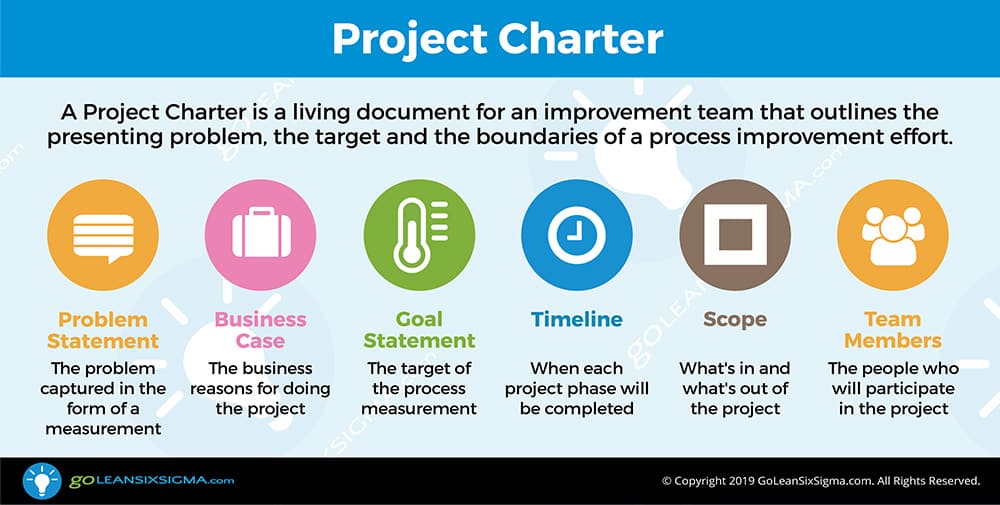
The Project Charter is a living document that outlines a process improvement project for both the team as well as leadership. Teams use the charter to clarify the process issue being addressed, the reason for addressing it and what “success” looks like for those working on it....

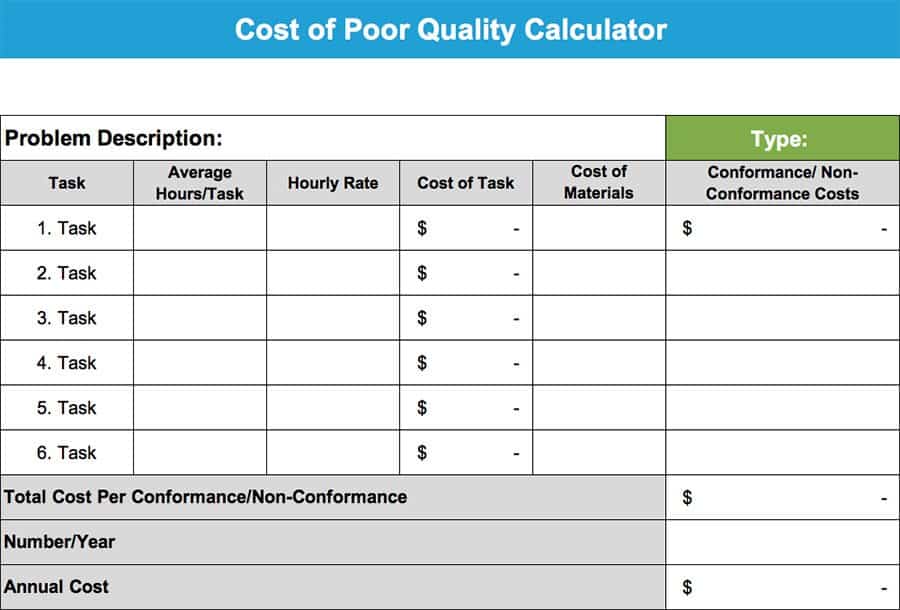
summary Summary Template Guides What is the Cost of Poor Quality (COPQ)? The Cost of Poor Quality (COPQ) quantifies the negative outcomes due to waste,

...

A3

summary Summary Template WHAT IS A3? On a literal level, A3 refers to a ledger size (11×17) piece of paper. But in the Lean Six

...

summary Summary Template Guides What is a Fishbone Diagram? A Fishbone Diagram is a structured brainstorming tool designed to assist improvement teams in coming up

...

summary Summary Template Infographics What is Failure Modes & Effects Analysis (FMEA)? Failure Modes & Effects Analysis (FMEA) is a risk management tool that identifies

...
A Value Stream Map displays the high level process steps along with key process data....

summary Summary Template Guides Infographics Anyone who’s had a busy day at work can appreciate the value of “downtime.” However, when you start to see

...

No post found.

START FREE
GREEN BELT TRAINING

Accredited by PMI. Over 15k glowing reviews.