skip to Main Content

Histogram - GoLeanSixSigma.com

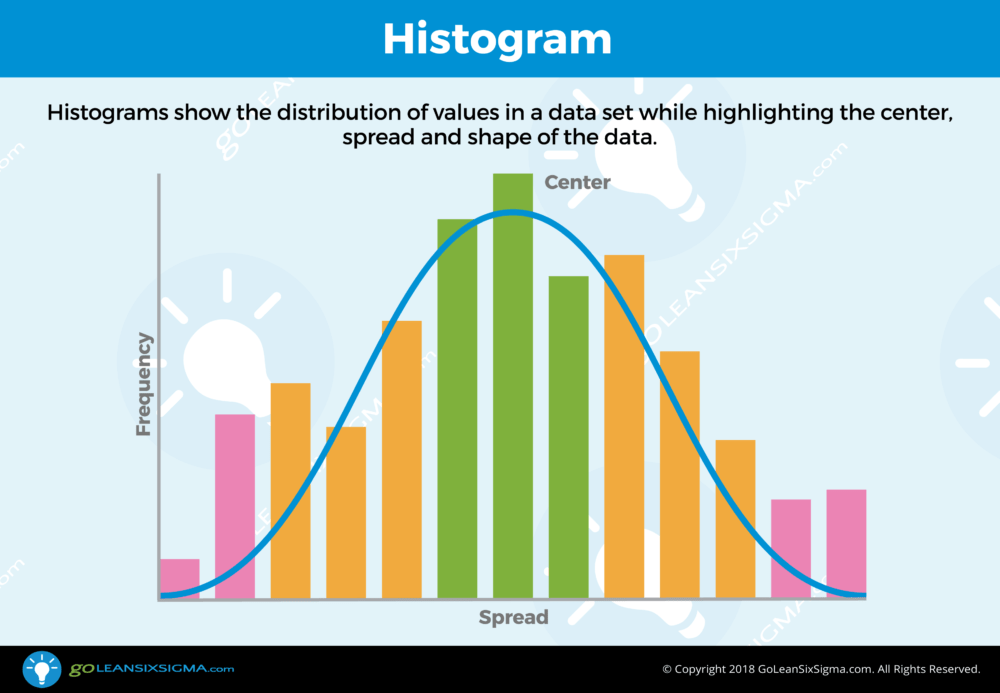
Histograms, also known as Frequency Plots, are a are visual displays of how much variation exists in a process. They highlight the center of the data measured as the mean, median and mode. They highlight the distribution of the data measured as the range and standard deviation and the shape of a Histogram indicates whether the distribution is normal, bi-modal, or skewed.

Histogram Template


Histogram Training - GoLeanSixSigma.com

Histogram Training
Single Module

For a better understanding of the Histogram and an overview of Lean Six Sigma, check out our Histogram Training!


For a better understanding of Histograms and an overview of Lean Six Sigma,check out our Free Lean Six Sigma Yellow Belt Training, Green Belt Training or Lean Training.

Cart
Search