analyze
Home » analyze
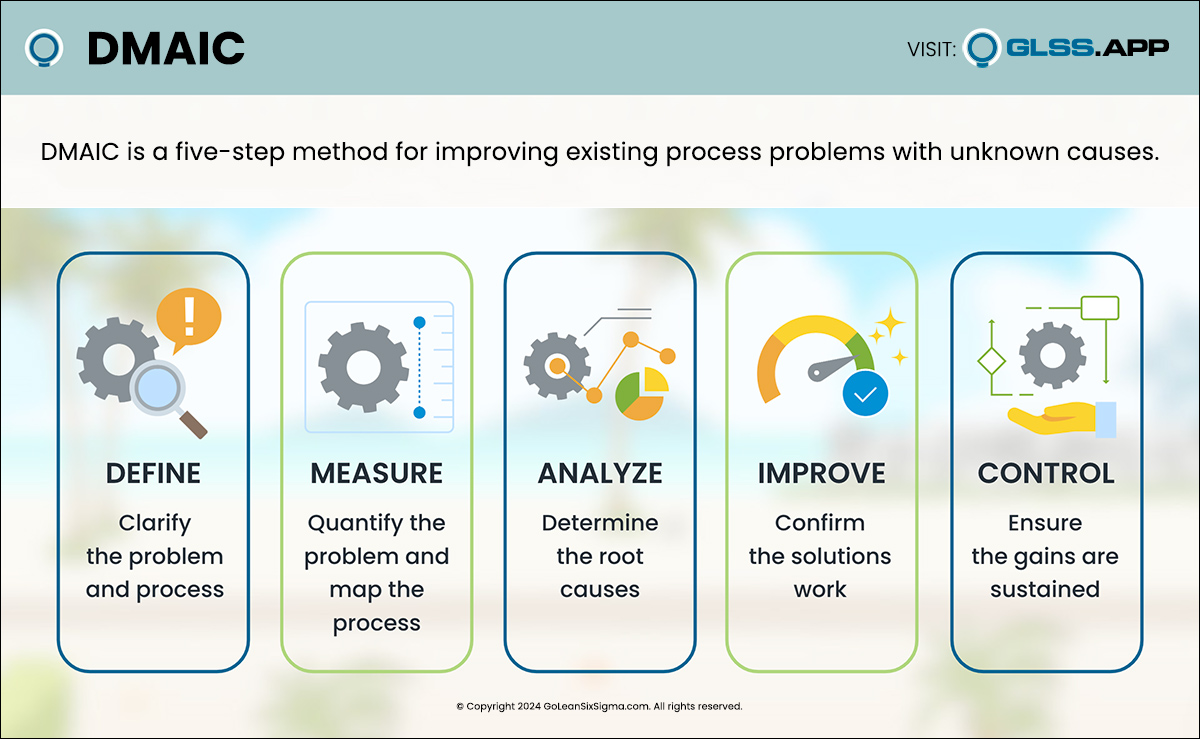
DMAIC is the problem-solving approach that drives Lean Six Sigma. It’s a five-phase method—Define, Measure, Analyze, Improve and Control—for improving existing process problems with unknown
...The Cause & Effect Diagram is a popular tool and it appears in most continuous improvement projects. But in reviewing the project examples and publications,
...When organizations want to address an issue, they frequently bring people together to determine what actions to take. Often, part of the group’s process is
...The Value Stream Map is a critical tool within the Lean methodology. It serves as the basis for documenting the “As Is” state of the
...No post found.


