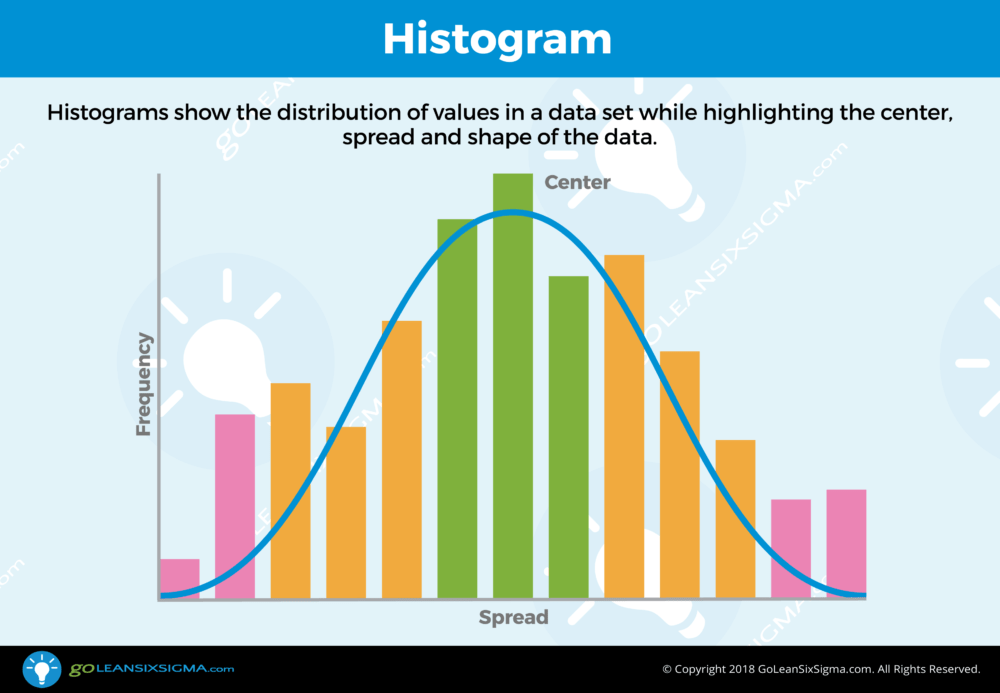
Histograms, also known as Frequency Plots, are a are visual displays of how much variation exists in a process. They highlight the center of the data measured as the mean, median and mode.
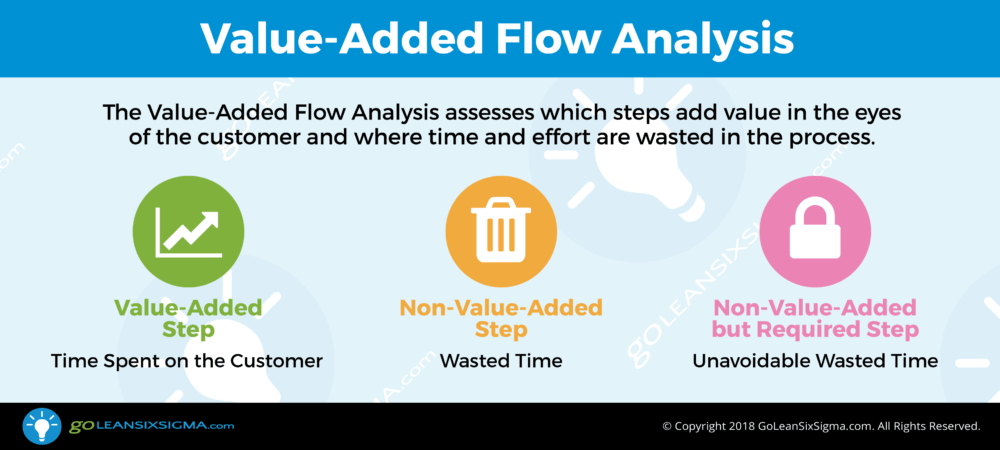
summary Summary Template What is a Value-Added Flow Analysis? Value-Added Flow Analysis combines two powerful tools into one. The Value Analysis differentiates steps that add