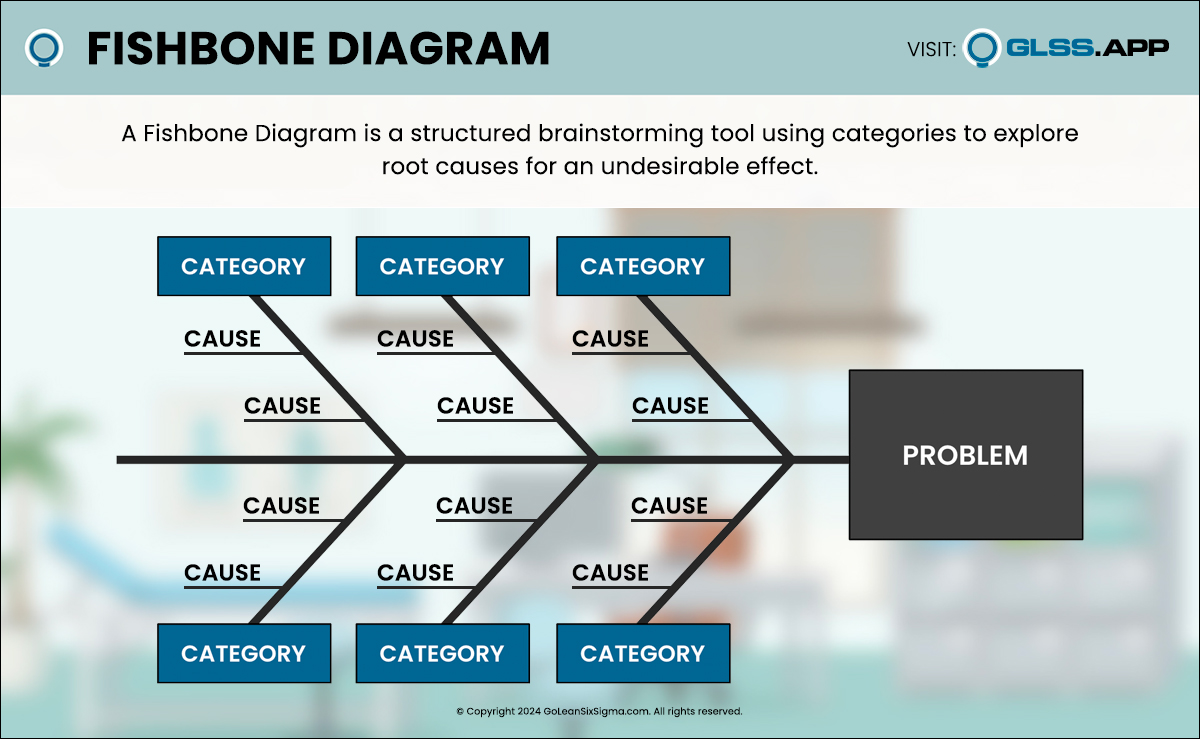
summary Summary Template Guides What is a Fishbone Diagram? A Fishbone Diagram is a structured brainstorming tool designed to assist improvement teams in coming up
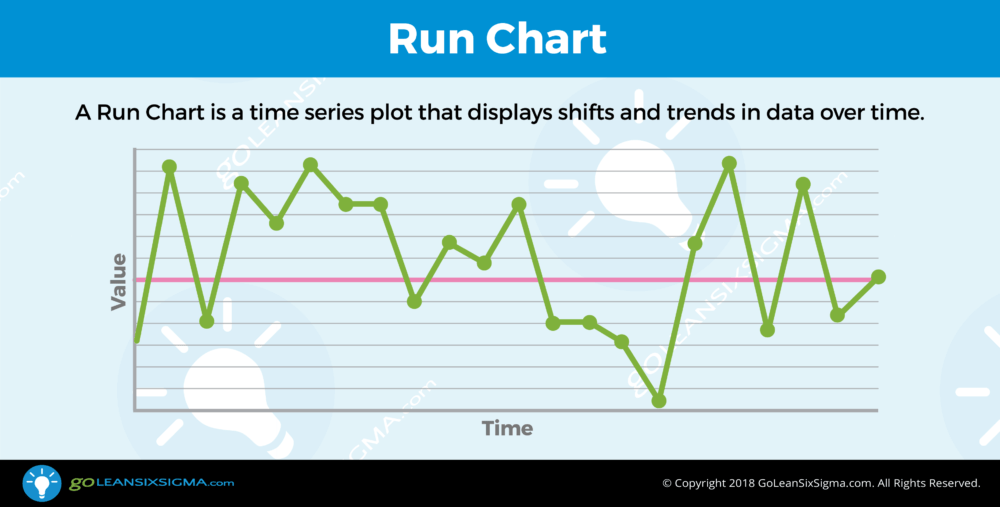
A Run Chart is a time series plot that displays shifts and trends in data over time. This kind of chart can display continuous or discrete data and generally appears with a median or average line.
summary Summary Template What is a Help-Hinder Worksheet? Help-Hinder is a method for surfacing team issues before they appear. The approach involves having each person
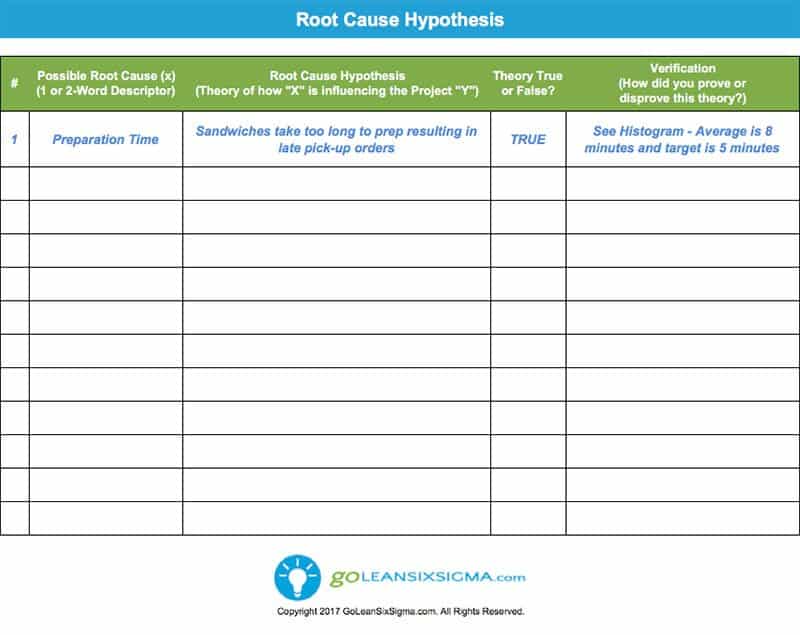
summary Summary Template What is a Hypothesis Testing Plan? The Hypothesis Testing Plan provides an analysis framework for verifying root causes. The plan involves documenting
summary Summary Template What is a Communication Plan? The Communication Plan guides the meeting process, messaging, method, frequency, and target. The Communication Plan is the