What Exactly is Baseline Data? In the Lean Six Sigma world, baseline data is a measure of how a process is performing (were you thinking “baseball?”). The “base” refers to the start of the improvement effort and the “line” refers to the level of capability.
What does baseline data look like? Below are some typical process baselines:
- 15% of applications require rework
- It takes 25 minutes on average to process a request
- There is ½ ton of scrap wasted every month
- Customers are transferred approximately 4 times per call
It’s the starting point of any process improvement effort and it includes the main metric being tackled. It’s the measurement that appears in both the Problem and Goal Statements:
- Problem Statement: For the past 6 months, it has taken an average of 25 minutes to process a request for product information which results in a backlog of a month’s worth of requests and a potential loss of $25K/month in sales
- Goal Statement: Reduce the time to process product information requests from from 25 minutes to 15 minutes by end of Q4
There could be other measurements of the process such as number of steps, emails and phone calls involved in each request. But there has to be one main metric—the baseline is a clear measure of the process capability.
Why Do We Need to Baseline a Process?
How do you know how far you’ve come if you don’t know where you started? The first step in improving a process requires understanding the current state. Unless we establish a way to measure the “as is” state of the process, we won’t have anything to compare our improvements to later. Measuring the baseline is the only way we’ll be able to tell if we made a difference with our countermeasures.
Is There Truly a Problem?
We may observe waste in the process. We might have picked this process because of customer complaints. But how much waste is there? How many complaints do we receive? How do we know there’s truly a problem? The baseline answers the question, “how bad is it?” Without hard data it’s often anecdotal evidence driving the effort or it’s based on someone’s opinion. This is where we ask for the facts. The facts may say there’s not much of a problem, but that’s good information too. It’s not that big of an issue, then spend your energy elsewhere.
The Horse Has Left the Barn
It’s important to establish the baseline right away because there’s a danger involved in waiting. Once you announce you’re going to focus on improving a particular process, people may want to help you by tweaking it. They may start changing the process before you have a chance to establish the current state.
I worked with a hotel director who wanted to reduce the amount of amenity waste (e.g. the number of mini shampoo & soap bottles thrown out before they were empty) but as soon as the housekeeping staff heard about the project, they started saving the little amenity bottles. The process was shifting already. Don’t wait.
What’s a Good Baseline Measure?
The decision of exactly what to measure is important to consider. Some measurements are obvious but it’s key to decide what works best for your project. There are endless ways to measure a process, but we’ll cover what drives two common baseline measurements—something is taking too much time or something is coming out wrong (with defects). Each of these requires consideration:
Time:
- You could measure days, hours, minutes, seconds, etc.
- Be as specific as you think useful
- You can convert time into “% Late” but not the other way around
- You can capture the average or the median (or both)
- Consider capturing the variation (the goal is always to less variation)
Defects:
- You can capture # of Defects per Unit or per time period
- You can capture the % Defective (by counting the total and dividing it by the defective units)
- You can capture the Yield (that’s 1 – % Defective) which might make more sense for projects such as “Increase the Sales Yield from 10% to 15%”
What About Other Measurements?
The main metric is key since that’s connected to the Problem and the Goal Statements. But the goal is to build your understanding of the process so it’s smart to consider other angles of the baseline data.
How Much Variation Is In the Process?
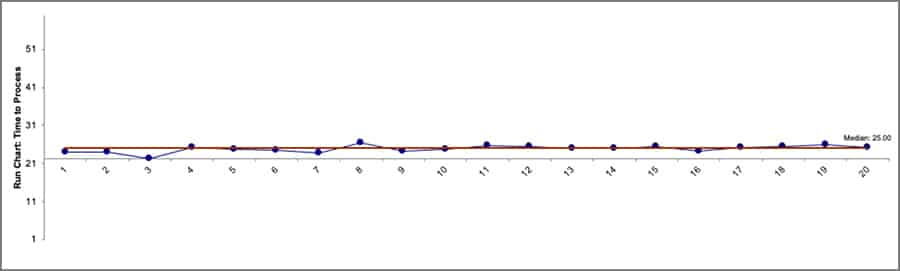
An important thing to understand is how much the process fluctuates. Averages can conceal a second problem of an unstable process. Take a look at the three Run Charts below. They’re each tracking the amount of rework involved in processing requests for product information. Each Run Chart displays an average of 25 minutes to process requests. But they look different.
Run Chart 1: Time to Process Requests in July
Run Chart 2: Time to Process Requests in July

Run Chart 3: Time to Process Requests in July

The processes do not behave the same way. The average is 25 minutes for all three but process Number 1 has a Standard Deviation of 5 minutes while Process Number 3 has a Standard Deviation of 25 minutes. That’s a big difference that you’d miss if you were zeroing in on the average by itself. Process Number 3 is in much worse shape so we’ll focus on that one going forward.
Collecting data over time is key. You can capture the average but make sure you have the baseline data so you can understand standard deviation, range and other measures of variation. The ideal is that your improvement efforts contribute to a reduction in process fluctuation. The process should become more predictable since that’s good news for the business and the customers.
What About Stratification Factors?
Collecting the baseline data centers around the goal measurement, but that doesn’t mean you should have tunnel vision and collect only that data. You should always look for ways to “slice” the data. The idea is to consider the “what, who, when, and where” of the data. Given the processing time example above, here are some ways to stratify the data:
- What: Simple vs Complex product requests
- Where: Product information requests in the Western vs the Eastern Region
- When: Requests by season
- Who: Requests by fulfillment processor
Stratification Factors

You’re still collecting the baseline data, but you’re gathering data related to the baseline so you can look for clues. Does it take longer during the fall when the season picks up? Do new processors take longer than experienced processors—or vice versa? Is there a correlation between complex products and time to process the requests? You can collect great information up front while collecting baseline data.
What Happens Once you Make Improvements?
Now we’ll jump to the end of an improvement effort. Having captured the baseline data, you can use it to showcase the improvement gains once the root causes have been addressed. In the case of the Product Information Request Process, the team’s countermeasures succeeded in dropping their average from 25 minutes down to 14 minutes.
That makes a nice Bar Chart:

But an even more impressive display is a simple Run Chart. It shows not just the drop in the average time, but the reduction in variation. It tells you that the improvement was not a fluke. That’s a good chart to use as you continue to monitor the process going forward.

Are We Done?
Never. The beauty of Continuous Improvement is the Pursuit of Perfection. The team reduced processing time down to 14 minutes. Can they do better? Always! They’ve probably already got a list of ideas of what to change for the next round of improvements since they’ve got a new baseline. It all begins with the baseline. Getting that data sets the standard for improvement. It also begins the hunt for clues that result from understanding the process.
