✔ 14-day free trial ✔ No credit card required ✔ Start training immediately
Annual Plan: $499 / year
Annual Plan: $17,499 / year($349.98/seat/year)Monthly Plan: $1,999 / month($39.98/seat/month)
Home » scatter plot
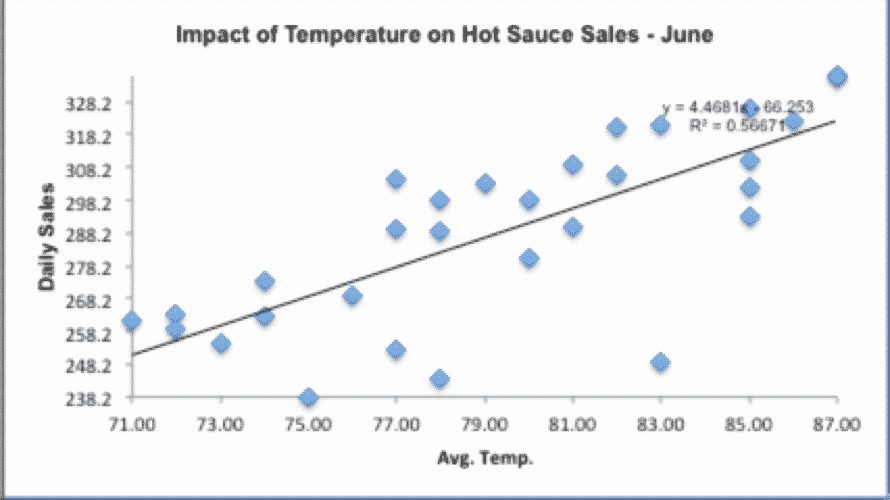
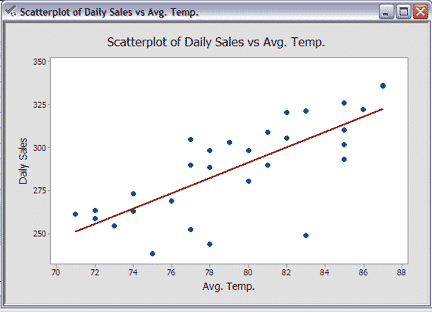
What’s A Scatter Plot? A Scatter Plot is a chart that shows the relationship between two variables (if any). A Scatter Plot is also known
What’s a Scatter Plot? A Scatter Plot is a chart that shows the relationship between two variables (if any). A Scatter Plot is also known
No post found.