The Fishbone Diagram is a visual tool used in Lean Six Sigma to identify root causes of problems. It resembles a fish skeleton, with the main problem at the head and potential causes branching off the spine into categories, facilitating a systematic approach to problem-solving.
Also commonly known as a Cause and Effect Diagram or an Ishikawa Diagram, Dr. Kaoru Ishikawa created the Fishbone Diagram in the 1960s to measure quality control processes in the shipbuilding industry.
Like a medical diagnosis, a Fishbone Diagram systematically analyzes symptoms to pinpoint the underlying cause of a condition.
Fishbone Diagram Components
The Fishbone Diagram is a visual tool used in Lean Six Sigma (LSS) methodology to identify and categorize potential causes of a problem.
Problem Statement
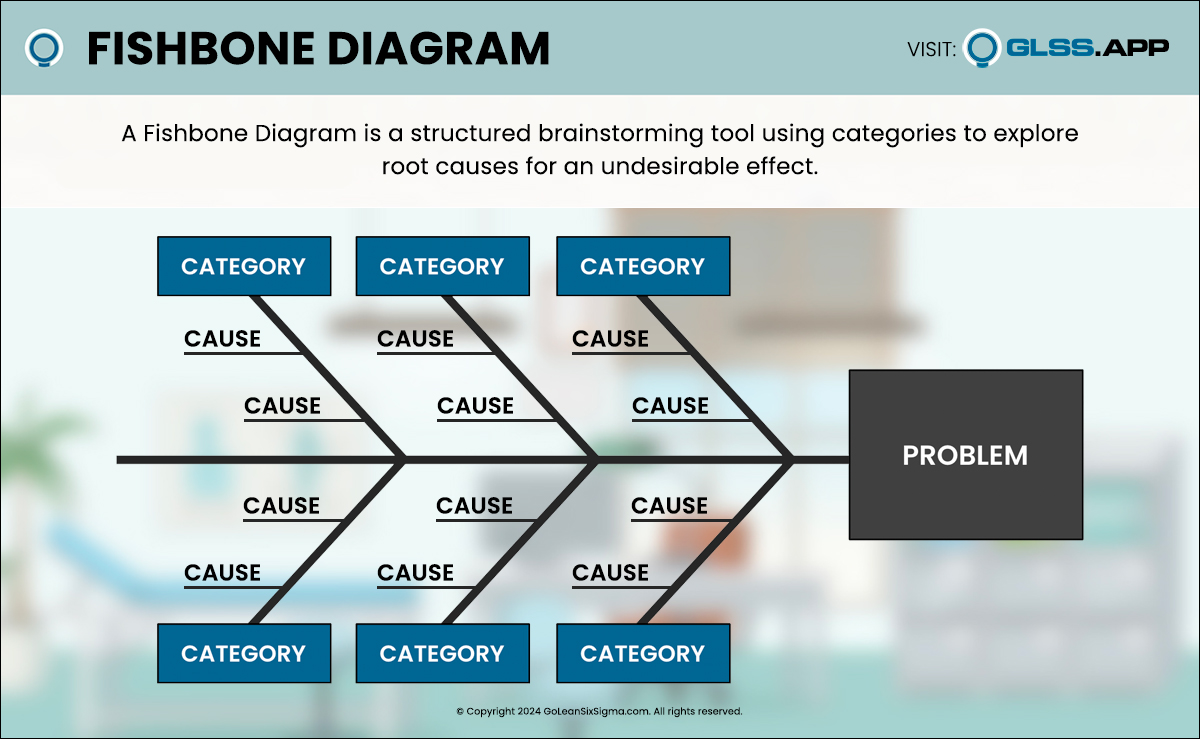
When laying out the diagram, the primary component—and the first step to identify—is the Effect or Problem Statement. This runs the length of the fish from its head backward along the “spine.”
Categorization
Branching off from the spine are diagonal branches—the bones of a fish—which are the different primary categories of potential causes of the problem.
Major Contributing Factors
Smaller branches run from each Primary Category—major contributing factors—each examining a possible reason for an effect.
Like analyzing any condition, a doctor examines all symptoms and narrows the possibilities until discovering an accurate diagnosis.
Primary Categories are named in any way suitable to study the problem, but, most often, users will integrate the following six categories—known as the 6Ms—which have proven most successful in identifying root causes:
- Man/Mind Power (People)
- Method (Process)
- Machines (Program)
- Materials (Product)
- Measurements (Policy)
- Milieu/Mother Nature (Place)
Fishbone Diagram: Root Cause Analysis
During the Analyze Phase of the DMAIC process (Define, Measure, Analyze, Improve, Control), the Fishbone Diagram is an excellent tool to help identify potential causes. However, a visual chart system by itself might not always lead to the root cause of the problem.
As any doctor knows, one should use all of the tools and knowledge available to determine a correct diagnosis. (And this is the mindset you and your team will develop in our LSS training programs.) That’s why users of the Fishbone Diagram will often apply a second technique, the 5 Whys.

Microsoft famously used these methods to decode buggy software in early versions of their Windows operating system. Amazon used the technique with its online shopping interface.
The 5 Whys is a complementary approach for root cause analysis to facilitate problem-solving by encouraging you to ask “Why” repeatedly to explore cause-and-effect relationships.
By asking successive “Why” questions, you and your teams can peel back layers of causality and uncover deeper insights into a root cause.
Fishbone Diagram: 5 Whys Integration
When integrating the Fishbone Diagram with the 5 Whys, make sure you’ve identified your Problem Statement (the spine of the fish). Remember that clarity and precision are essential when doing this.
Next, branch out and label each of the categories of potential causes.
Using the 5 Whys technique under each primary category is best. If a possible Problem Category is “Materials,” ask, “Why is the problem with materials?”
There often may be multiple possibilities. Each possibility will branch from there as a contributing factor.
For example:
Problem Category: Materials
Ask 5 Times: Why is the problem materials?
- Cost
- Sustainability
- Availability
- Quality
- Compatibility
To drill down on the first contributing factor of cost, create a smaller branch and:
Ask 5 Times: Why is cost a problem?
- Inflation
- Vendor Overhead
- Scarcity of Raw Materials
- Exchange Rate
- Increased Taxes, Tariffs, or Other Fees
Now you can move on to the next Problem Category (#2) and repeat the process:
Ask 5 Times: Why Sustainability Is a Problem…
Follow this approach and drill down into each possibility five times.
Using 5 Whys is just one of many ways to increase the effectiveness of your Fishbone Diagram. If you’re ready to level up, one of our Master Black Belts offers some powerful Cause-and-Effect customizations you can try to find more effective solutions and improvements.
Example of a Fishbone Diagram
Combining the Fishbone Diagram with the 5 Whys has been successfully employed for decades. Although these methods originated in manufacturing, they have become essential tools in every industry to determine Root Cause Analysis.
Microsoft famously used these methods to decode buggy software in early versions of their Windows operating system. Amazon used the technique with its online shopping interface.
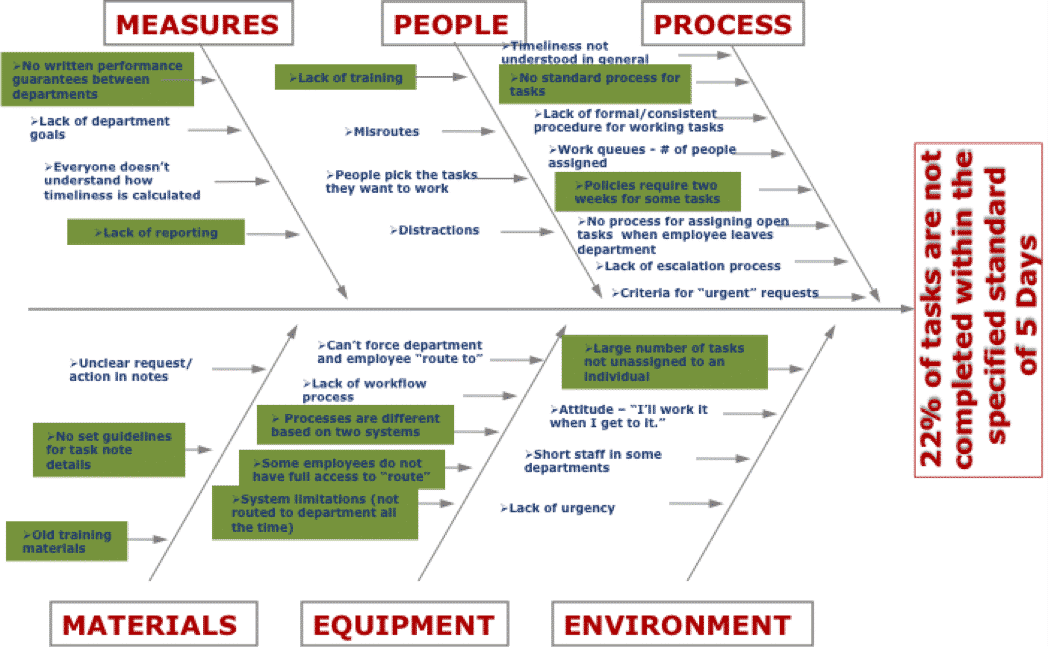
You can see in the above image, how the Fishbone Diagram helped find several problems, leading up to the discovery of the Root Cause and its solution.
Learn more about the image above and how it helped reduce defects by 19% by using a Fishbone Diagram.
Advantages and Disadvantages of the Fishbone Diagram
Although recognized for its many advantages and insights into finding the root cause of a problem, the Fishbone Diagram is not ideal for every circumstance.
Here are some advantages and disadvantages of using the Fishbone Diagram.
Pros:
- Easy to implement
- Promotes teamwork and brainstorming
- Follows a predictable and systematic approach that has proven results
- Little to no cost involved, outside time spent
Cons:
- Not ideal for solving large or complex issues
- Sometimes difficult to keep free of bias
- Can become time-consuming
If the Fishbone Diagram isn’t the right tool for the process, it might be time to expand your toolkit. With GLSS training, teams learn the right tools to use by completing Process Improvement projects with real business impact.
Do you and your team want to learn more about Lean Six Sigma problem-solving techniques and methodologies like the Fishbone Diagram? Register for our free training today.
