Increasing Daily Meat Production By 25% With GLSS
Home » Case Study » Increasing Daily Meat Production By 25% With GLSS
Where’s the beef? Find out how GoLeanSixSigma.com Black Belt Alexander Paselk increased meat production from 1,800 kg/d to 2,250 kg/d using Lean Six Sigma. His project increased production of beef, poultry and lamb. Congratulations to Alexander for applying Lean Six Sigma in helping feed the world!
Al-Mawarid is part of the Gulf Resources Meat Company (GRMC) based in Kuwait that sells into the Arabian Gulf region. The company efficiently and successfully runs a meat processing plant and all of the beef, lamb and chickens are processed within the factory. All of the meat processed at the plant and made into products is sold by the GRMC Al-Mawarid brand.
All the beef processed at the plant is dry-aged before it is cut and packaged. The plant has a 500-square-foot dry aging room that can hold many hanging sides, or two weeks of product. Computers monitor temperatures in coolers. The plant is one of a very few fully inspected plants that handle both red meat and poultry.
The company had introduced new process machines and tried different production steps. They increased competent employees and tried to increase the daily production amount for several years. However, the company did not have success. Instead, the operation costs increased and the production costs were not break even. Therefore, it was the perfect Lean Six Sigma Black Belt project.
Executive Summary
Business Case
The production process isn’t smooth (delta = 842 kg/d). There are too many products in the process. The management is complaining that the daily operation costs are too high. The production didn’t reach the break even point.
Root Cause Analysis
- There are too many products on the list
- 20% of the products are responsible for 80% of the production
- The other products are consuming too much operation time
- There is not any monthly production plan available
- The operator does not know the daily production
Solutions Implemented
- Increased the production of best-sellers
- SM and PM are planning the production for the month
- Reduced the amount of available products
Project Results
- Reduced products from 85 to 55
- Production of products for external clients during the overtime
- The production focus is on 80% baseline products (best-sellers)
- The GM, PM and SM are planning the production monthly now
- The resources usage is leveled and optimized
Graphical Display of Improvement

Key Words
- Production Manager: The PM is the head of the production department (19 persons incl. PM & QC)
- Working Hours: The working hours are from 07:00 am to 03:00 pm from Sunday to Thursday. Breaks are from 09:00 to 09:15 am and 12:00 to 12:45 pm
- Chiller: The chiller is a chilling area 0 – 5 degrees C in order to chill down fresh meat products (expiry date is only 5 days)
- Quick Freezer: The quick freezer is a cooling area -18 degrees C in order to quick freeze frozen meat products (expiry date is 9 months)
- Grinder: A meat grinder or meat mincer is a production appliance for fine chopping (‘mincing’) of, or mixing of raw meat
- Mincer: A production equipment used for making smaller pieces of meat for further production steps
- Soy Protein: Soy protein is an additive for frozen meat. The frozen meat expiry is 9 months
Project Charter
Problem Statement
The management is complaining that the daily production amount of meat is not increasing. The average amount of daily production is 1,800 kg/d. The amount is the same since 3 years.
Goal Statement
The goal is to increase the daily production amount of meat to an average of 2,250 kg/d in Q4 in 2016.
Scope
- Process Start: Sales department places an order
- Process End: Storekeeper reports weekly cold store information
- In: The production department is preparing the weekly order in 6 days (Sunday to Thursday)
- Out: The sales department follows the request of the customers. Purchasing additional equipment or employees.
Business Case & Benefits
Improvement for the daily average production amount will result in higher revenue.
Timeline
| Phase | Planned | Actual |
| Define | Oct. 18 – Nov. 7 | Oct. 18 – Nov. 7 |
| Measure | Nov. 8 – Dec. 5 | Nov. 8 – Dec. 9 |
| Analyze | Dec. 6 – Dec. 26 | Dec. 20 – Jan. 8 |
| Improve | Dec. 27 – Jan. 23 | Jan. 9 – Feb. 6 |
| Control | Jan. 24 – Feb. 6 | Feb. 7 – Feb. 20 |
Team Members
| Position | Person | Time Commitment |
| Team Lead | Alexander | 25% |
| Sponsor | Waleed CEO | 15% |
| Team Member | Saeed GM | 25% |
| Team Member | Kottob PM | 25% |
| Team Member | Mustafa QC | 20% |
Voice of the Customer Translation Matrix

Key Takeaway: The production of meat need to increase in order to be financial break even.
SIPOC

Key Takeaway: The scope of this project goes from the point of receiving the order to the point at which the processed meat is available.
Data Collection Plan

Key Takeaway: The QC manager was largely responsible for all data collection The data got collected in format hh:mm. The PM adjusted job duties to accommodate. Therefore, a MSA is not necessary.
Fishbone Diagram

5 Whys
Management “Whys”
Why does no clear guidance & instructions cause a fluctuation in daily production amount?
- No clear daily plan for operators
- Production preparation needs more time
- Material needs to get moved out of cold storage area
- Preparation is only possible after receiving the instruction
- Operator is highly depending from Production Manager
Why 1: Fluctuation in daily production
Production plan isn’t available
Why 2: Production depends on stock
Store Keeper is responsible for stock
Why 3: No forecasts available
SM doesn’t not speak with PM
Why 4: Baseline products aren’t constant
PM doesn’t plan
Why 5: No space for products in store
Wrong daily production plan
Key Takeaway: Root cause analysis will focus on process and management.
Hypothesis Testing Plan

Key Takeaway: Hypothesis tests confirmed that the production process of baseline / additional products are not stable and that other processes didn’t change.
Hypothesis Testing Results

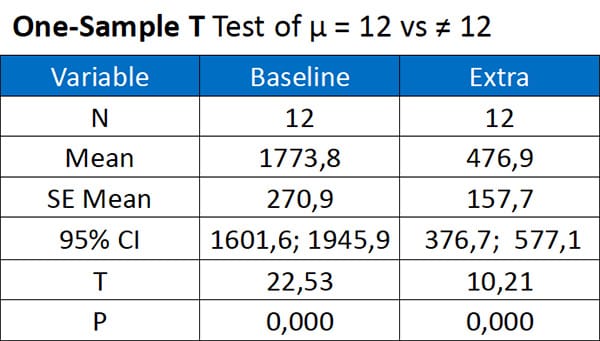
H0 the monthly production is equal for the baseline products and additional products.
HA there is a difference between the monthly production – the monthly production is not equal.

Key Takeaway: P is below 0.05 for all tests. Therefore I’ve to reject the H0 Null Hypothesis and pursue the alternative Hypothesis HA.
Impact Effort Matrix
- Organize the production plan for the whole month / period
- Set up in order the daily production in order to optimize the equipment cleaning time
- Buy new equipment, more efficient and easier to handle
- Rearrange the production area in order to minimize the movement of products
- Conduct tasks in parallel so operators can arrange there work tasks
- Focus & Increase the baseline products (best seller)
- Organize extra processing (external vendors) during overtime
- Preparing package boxes during the overtime

Key Takeaway: The team planned to implement the two solutions in the easy / high impact quadrant.
Risk Management Plan

Key Takeaway: Cross-Training mitigated the risk of wrong planning for the daily minced meat production.
To Be Map
Swimlane Map

Key Takeaway: The PM is responsible for monthly production plan. The PM gets the forecast from the SM. The storekeeper is responsible for the stock of materials (define min & max amount).
Before & After Time Data

Key Takeaway: Implemented solutions decreased variation of baseline products and achieved project goal of 1,800 kg/d.
Monitoring & Response Plan

Key Takeaway: The monitoring plan factors the leading indicators of daily production of baseline products, cold store inventory and total daily production amount.
Control Chart of the Project
The minced meat production is a top seller. The production has a volume of 16,11% of the total production.

Key Takeaway: The team is continuing to work on the special causes of variation. The Lower Control Limit of 213,8 kg/d is the Response Plan trigger.
Appendixes

Key Takeaway: The Pareto Chart shows that 20% of the products are responsible for 80% of the daily production (C = chilled, F = frozen food).
One-Sample T-Test
There have been complaints from management of Al-Mawarid Company. One hypothesis from the GM is that the daily amount of production is equal each month of the year. Let us see if the data and test supports this hypothesis. Let us look at the average production amount in kg/d.


Key Takeaway: The daily average production amount is not equal for the year 2016. Improvement focused on the production management process.
Stakeholder Analysis (Advanced)

Key Takeaway: The production manager has a key responsibility for a successful project. Therefore, the communication plan is very important (dead lock).
Communication Plan

Key Takeaway: The production manager has a key responsibility for a successful project (dead lock). The communication plan was instrumental in making sure everyone knew what was happening with the project at all times.
Results of Weighted Criteria Matrix

Production Hall Floor Plan With Operators

Key Takeaway: The equipment set-up is with the process flow. Additionally, the space is limited for any adjustment or change of the set-up.
Detailed Map
Swimlane Map

Key Takeaway: The process is complicated. The sales manager is not interacting direct with the Production Manager. The weekly production plan segment seems to be depended from the cold store inventory.
Project Specified Map
Spaghetti Map

Key Takeaway: The production map shows that the equipment set-up is with the process flow and the walking distance is optimal between the process steps.
Implementation Plan
New Production Management Plan

Key Takeaway: The team will update the processes before adjusting the production. The GM and PM will implement guidelines and protocols. Visual management will be available for the operators.
Final Statement – Innovation Transfer Opportunities

Key Takeaway: The improvements implemented for one baseline product can easily be transferred for all baseline products – time to get the production lean!


