Manufacturer Increased First Run Parts By 30% With GLSS
Home » Case Study » Manufacturer Increased First Run Parts By 30% With GLSS
GLSS Green Belt James Fuhrman’s Project Storyboard involved increasing first run parts from 60% to 90% within two months. This project achieved 87% within the aggressive schedule while dramatically reducing manufacturing lead time.
Improvement in first run parts yield increased throughput, while process simplification reduced manufacturing lead time, which allowed customer orders to be filled more quickly. This produces a cascading effect of improved customer satisfaction, lower cost and a reduction of order-to-cash time, improving cash flow and ROI.
– Bill Eureka, GoLeanSixSigma.com Master Black Belt Coach
Executive Summary
Business Case
When products are scrapped to due programming, the company is losing money. On average the company is at 60% on new parts. That means that 40% of all new parts are wrong the first time. This problem is costing the company thousands of dollars.
Root Cause Analysis
There were steps that were causing confusion, and there was also disorganization that needed to be addressed.
Solutions Implemented
We did a 5S of the Finn Power and removed steps that were not value-adding in the overall process.
Project Results
We took our scrap rate for first time parts from 60% up to 87%. I believe we have done great work on this project, and also believe we can still get better results as this process settles in.
Graphical Display of Improvement

Key Takeaway: The results were amazing with all the push back at first (we have always done it this way). Everyone was amazed how much the process has helped their stress level.
DEFINE PHASE
Project Charter
Problem Statement
The problem is that first run parts are only right 60% of the time. The parts that are wrong are due to several issues – wrong holes in wrong location, wrong materials, wrong size of part, wrong program numbers. This is costing the company thousands of dollars per week.
Goal Statement
Increase the first run parts from 60% to 90%.
Scope
- First Process Step: Orders come in
- Last Process Step: Orders are shipped
- In Scope: Process, Finn Power, blueprints, storing system
- Out Scope: New software, new tooling, cross training
Business Case & Benefits
First run parts are only right 60% of the time. When this happens, the customer has to wait for the parts longer than expected. The price of the product is higher than competitors prices are due to rework and scraped materials.
Timeline
| Phase | Planned | Actual |
| Define | November 20 | November 17 |
| Measure | November 30 | November 30 |
| Analyze | December 25 | January 2 |
| Improve | January 15 | January 18 |
| Control | January 30 | February 3 |
Team Members
| Position | Person | Title | Time Commitment |
| Team Lead | Kurt Spud | 40% | |
| Team Member | Jim | Programmer | 35% |
| Team Member | Terry | Manager | 5% |
| Team Member | Bill | Finn Power | 20% |
Key Takeaway: Everyone was very exited – project started great.
SIPOC

Key Takeaway: The process was overprocessed, we had to take out two steps and move another step so the parts were not going to the same person twice.
As-Is Detailed Map Segment

Key Takeaway: The team learned that there were extra steps in the process that could be eliminated (waste).
Value Stream Map

MEASURE PHASE
Data Collection Plan

Baseline Data – Project Y
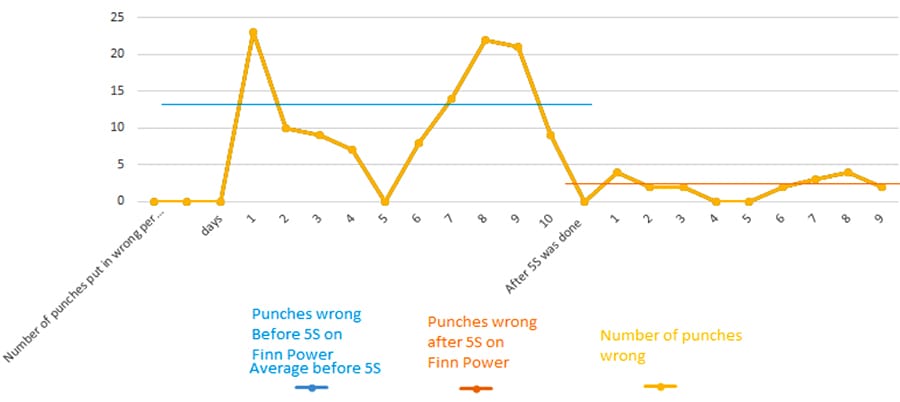
Key Takeaway: Before (left side of chart): there were lots of mistakes being made. After (right side of chart): the defect went down from 12 defects per day to 2 defects per day. This was on of the biggest gains for the overall process.
- DPMO #: Start 87,968, after Lean: 15,015
- Sigma #: Start 0.4, after Lean: Sigma # is 3.4
Baseline Data – Order Lead Time

Key Takeaway: This chart shows that working with Lean is making a difference in how long each order is in process. Every company should look at Lean. Amazing results!
ANALYZE PHASE
Fishbone Diagram

Key Takeaway: As a team we did some brainstorming on how or what may be causing our orders to take so long to complete.
Map Segment Showing Analysis
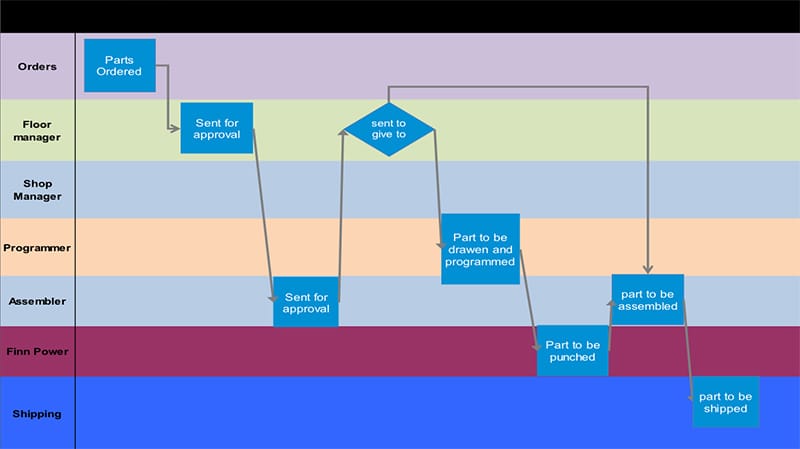
Key Takeaway: Process analysis showed a potential for removing time wasted during the approval state. Too many individuals had to look at what we were making.
As-Is Detailed Map Segment

Key Takeaway: A 5S effort showed the waste of motion – it also included assemblers which resulted in increased employee engagement.
Value-Added Flow Analysis
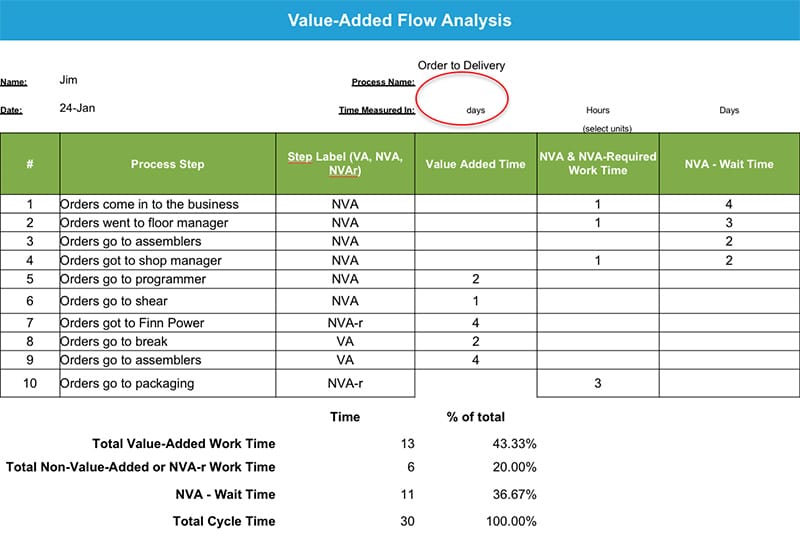
Key Takeaway: Biggest opportunity to remove wait time is the handoff from one department to another department.
Root Cause Hypothesis

Key Takeaway: Data shows that after brainstorming issues we were looking in the wrong direction. As you can see we narrowed down some of the issues to be addressed.
IMPROVE PHASE
Selected Solutions

“To Be” Map Segment

Key Takeaway: Process changes including restructuring the flow of parts and 5Sing the Finn Power area were the big ticket areas.
Spaghetti Map

Key Takeaway: By eliminating the assembler and the floor manager, we save an average of 1 day of wait time just by cleaning up the process.
Run Chart Showing Improvement

Key Takeaway: Improvements had an impact on our days. Orders were in process from start to ship.
CONTROL PHASE
Project Closure
Lessons Learned
- Remember to involve individuals from all aspects of the project.
- Make sure you follow up frequently on process.
- The 5S in a program seems to boost morale.
- Boost self-esteem by letting everyone know how things are going good.
Customer Impact
- Employees morale is up, this make production is up.
- Customers are not waiting on stoves.
Final Calculations
- First run production scrap when down from 11 parts to 2 parts per day
- Company is saving and average of $625 per week
- Stove wait time went from 30+ days to an average of 20 days
- Staff buy-in has gone up
- By making changes in production, we are able to do more cross training
Sign-off From Project Sponsor
After all the changes made from the top down, everyone feels more ownership of the new system. Things are going great. I am officially giving my stamp of approval for documented improvements. – James Fuhrman
Key Takeaway: The process has changed a lot and the ownership has gone way up. Now everyone feels that they count in the process. The customers are thrilled and parts are delivered before expected date.
Key Words
- Finn Power: a cnc punch press machine.
- Shop Manager: person who over sees parts coming in and out of shop.
- Floor Manager: person who assigns task to the floor personnel.
- Programmer: person that draws parts and make them where they can be punched on the CNC punch press machine.
- Assembler: person that puts the stoves together and gathers the parts to assemble.
- Brake Operator: person who folds part on a metal break.
Project Storyboard