


 Define
Clarify the problem and process
 Measure
Quantify the problem and map the process
 Analyze
Determine the root causes
 Improve
Confirm the solutions work
 Control
Ensure the gains are sustained


Great results!
"I had my entire team gain their Lean Six Sigma Green Belt through them and the content made sense to everyone – from those with little to no experience with Six Sigma and to those who were experienced."

Lots of fun working on projects!
"GoLeanSixSigma.com’s courses have put our teams on the right continuous improvement path. I had a lot of fun working on my project and their templates made the process so much easier and enjoyable."

Flexible and practical!
"The previous training we went through was a week-long boot camp that took us away from our daily work and there was no commitment to do any project afterwards. With GoLeanSixSigma.com, we were applying the tools to a real project which solidified learning much better."
Wow!
"GoLeanSixSigma.com does a great job explaining Lean in an easy to follow format – and that’s not an easy task. It’s what got me interested in their courses. The customer service they provide have exceeded my expectations."

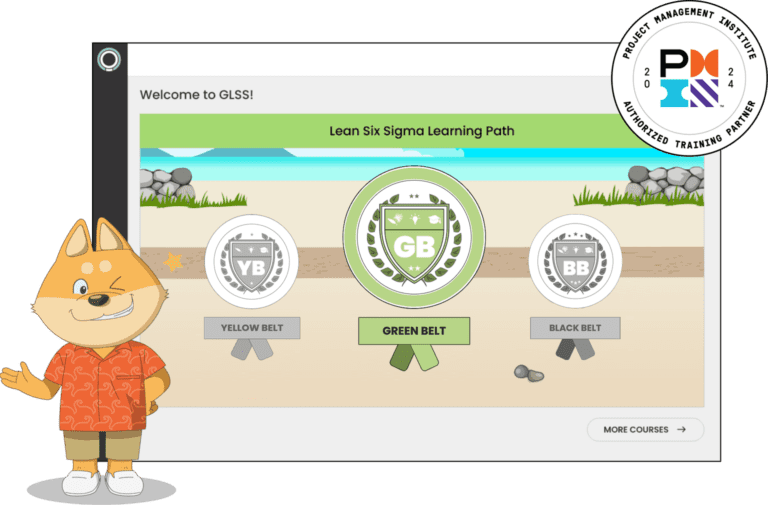
Yellow Belt
"Great course. I believe anyone, at any level of any organization, can benefit from the principles taught at GLSS. This approach to process improvement is explained in simple and practical terms, showing how everyone is affected by and can contribute to the overall success of their workplace."

Green Belt
"GLSS makes learning and implementing Lean Six Sigma concepts accessible. The content and exams are structured in a way that allows flexibility. It's detailed without containing a lot of superfluous information, and the resources provided by GLSS are plentiful. After looking at many online learning and certification resources, GLSS is the best."

Black Belt
"This was an excellent course. Very challenging and thorough. I have done other courses that no where near prepare you for the challenges and practical practice of Lean Six Sigma. This course was on par with my MBA studies. I highly recommend it!"