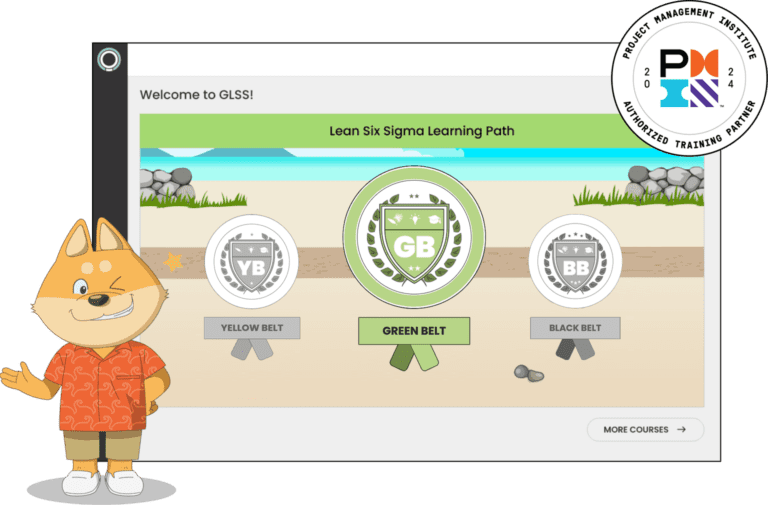
All Trainings & Certifications included.
- Yellow Belt Training & Certification
- Green Belt Training & Certification
- Black Belt Training & Certification
- Lean Training & Certification
- White Belt Training & Certification
- Online, self-paced learning format
- Project-Based Learning approach
- AI Master Black Belt Coach
SPEAK WITH OUR TEAM




POPULAR QUESTIONS
Here are some Frequently Asked Questions (FAQs) about our Lean Six Sigma Training & Certification.
If your question is not answered here, please feel free to contact us.
Our GLSS Membership gives you access to all our courses (White Belt, Yellow Belt, Green Belt, Black Belt, Lean) and future course updates and releases. The courses are entirely online and self-paced; Training & Certification (exams) are included, and there are no additional fees.
With the Individual Plan, you'll also get access to Kure for six months. Kure is our new app that automates Lean Six Sigma projects, allowing you to complete projects faster and with better results.
Kure is not included in our Team, Business, or Enterprise Plan but can be purchased separately.
To ensure the quality of our GLSS (GoLeanSixSigma.com) certification holders, recertification is required every two years.
The recertification process consists of retaking the course or submitting a Lean Six Sigma project through Kure.
Our new certificates now include a specified expiration date. If your certificate shows no expiration date, your certification will expire two years after the course completion date.
If your certificate has expired, it can no longer be verified. To renew your certification, please subscribe to our GLSS Membership.
If you have an existing account on our old platform, your course progress and certifications will not transfer. The certificates are new and improved in our new GLSS App platform, and course completion will be required to obtain them.
Your course progress will be maintained and transferred if you have an existing account on the GLSS App.
Our recommended learning path is Yellow Belt > Green Belt > Black Belt.
However, our platform allows you to complete the courses in any order.
Kure is our online project management platform that automates Lean Six Sigma implementation and streamlines project workflows to deliver measurable improvements. Kure walks users through each project step with Just-In-Time tutorials and in-app statistical analysis tools.
With the GLSS Membership Individual Plan, you'll also get complimentary access to Kure for 6 months.
Here are some Frequently Asked Questions (FAQs) about our Lean Six Sigma Training & Certification.
If your question is not answered here, please feel free to contact us.
Our GLSS Membership group plans give you and your users access to all our courses (White Belt, Yellow Belt, Green Belt, Black Belt, Lean) and future course updates and releases.
The courses are entirely online and self-paced; Training & Certification (exams) are included, and there are no additional fees.
Yes. To explore our platform and experience our courses firsthand, you can create a free account by clicking here. The 14-day free trial will provide access to our courses' first two training modules.
Select the “My Team” option to:
- Preview demo modules for all courses
- Explore the dashboard as an Organization Admin
- Invite other team members
- Log in to your account here
- Click "Organization" in the left sidebar
- Click the "Add User+" button
- Input the user's information and click “Add user” in the bottom right corner
- Or, add multiple users by clicking “Add multiple” in the top right corner
Yes. Our platform provides in-app user management features to add and remove users easily, simple and easy-to-understand course progress reporting, and more.
Yes. We encourage our learners to complete projects using Kure, our online project management platform that automates Lean Six Sigma project work with AI. The app helps ensure projects deliver measurable results by streamlining workflows and provides a standardized platform to showcase improvement metrics.
You can view our Help Guide to see how GLSS (GoLeanSixSigma.com) and Kure connect.
In addition to our Lean Six Sigma courses, we offer the following services:
1-on-1 Project Coaching – $1,499
- Master Black Belt facilitates the completion of an individual's Lean Six Sigma project via (6) 1-hour virtual sessions and email support.
Group Project Coaching - $9,999
- Master Black Belt facilitates the completion of 3 Lean Six Sigma projects for up to 20 participants via (3) 1.5-hour virtual sessions and email support.
Strategic Planning - $1,499
- Define strategy goals and launch supportive projects via (6) 1-hour virtual sessions with a Master Black Belt.
Reviews
Submit your review | |
1 2 3 4 5 | |
Submit Cancel | |
Clear and easy to follow training plan.
A good and convenient learning platform.
It's nice and very convenient. The modules are also easy to understand and navigate.
The modules really simplified the lean six sigma principles! Recommended for professional and even personal improvement!
The Yellow Belt Training & Certification was great! I learned a lot about improving processes and solving problems. The materials were easy to understand, and the instructors were really helpful. Now I feel confident in making things better at work. I'd definitely recommend this training to anyone who wants to learn practical skills for making improvements in their job.
Great visuals. It was easy to follow.
I enjoyed the Yellow Belt course. I hope to continue on with the remaining course.
I really enjoyed this course and hope to continue on with the lean six sigma courses.
Great learning tool.


