Search
Home » You searched for MiniTab
Search Results for: MiniTab

Want to simplify and automate your statistical analysis? Try Kure. GoLeanSixSigma.com Black Belts learn about each statistical test below in our Black Belt Training & Certification course –
...
We offer a 1-year license to Minitab for $599. If this interests you, please contact us for more information. However, we recommend using SigmaXL (a
...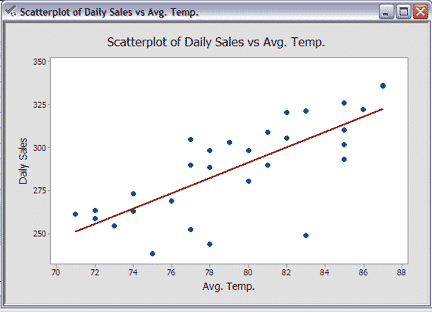
What’s a Scatter Plot? A Scatter Plot is a chart that shows the relationship between two variables (if any). A Scatter Plot is also known
...
What is a Run Chart? A Run chart is a graph that displays data in sequence over time. This kind of chart can display continuous or
...
What’s a Pareto Chart? A Pareto Chart is a quality chart of discrete data that helps identify the most significant types of defect occurrences. It
...
What’s a Histogram? Histograms are frequency charts. In Lean Six Sigma, they show the distribution of values produced by a process. In other words, a
...
What’s a Box Plot? A Box Plot is a graphical view of a data set which involves a center box containing 50% of the data
...
What’s Design of Experiments – Full Factorial in Minitab? DOE, or Design of Experiments is an active method of manipulating a process as opposed to
...
What’s Design of Experiments – Two Factorial in Minitab? DOE, or Design of Experiments is an active method of manipulating a process as opposed to
...
What’s Design of Experiments (DOE) – One Factor at a Time (OFAT)? DOE, or Design of Experiments is an active method of manipulating a process
...